Survey on Water Server Usage Frequency and Rate of My Bottle Users
The Office of Sophia Sustainability Promotion conducted a survey to assess the frequency of water server usage and the percentage of students who bring their own bottles to campus. The survey aimed to understand the effectiveness of water servers in promoting sustainable practices and reducing plastic waste. Key findings include the number of uses per day, locations of high usage, frequency of use, estimated cost savings, and the percentage of My Bottle users. Suggestions for future resource management and efficiency improvements were also outlined.
Download Presentation

Please find below an Image/Link to download the presentation.
The content on the website is provided AS IS for your information and personal use only. It may not be sold, licensed, or shared on other websites without obtaining consent from the author. Download presentation by click this link. If you encounter any issues during the download, it is possible that the publisher has removed the file from their server.
E N D
Presentation Transcript
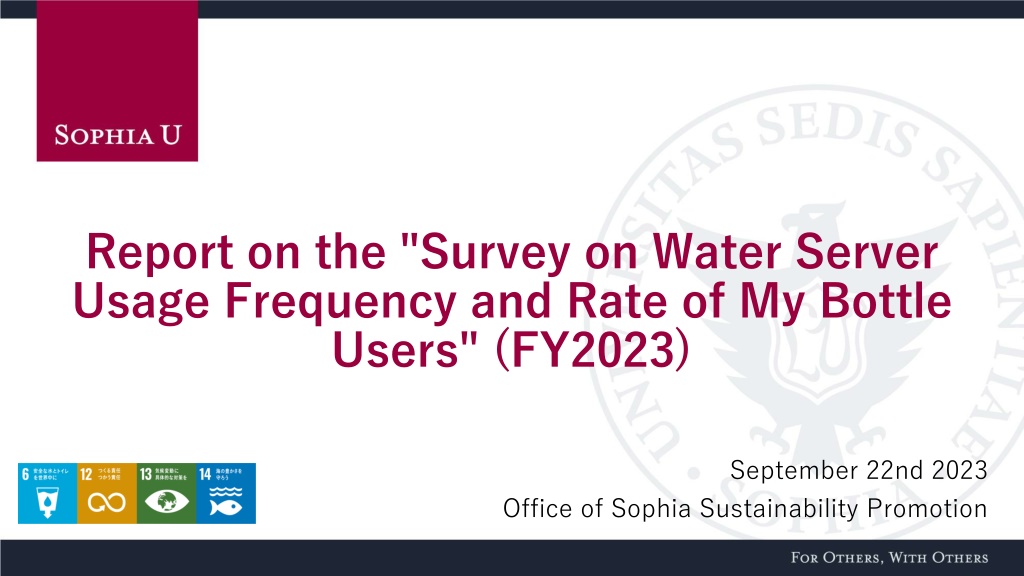
Report on the "Survey on Water Server Usage Frequency and Rate of My Bottle Users" (FY2023) September 22nd 2023 Office of Sophia Sustainability Promotion
Table of Contents Survey Objectives and Overview Page 2 5 Number of uses per day of the week Page 6 Number of uses per day per location Page 7 Frequency of uses in one day and estimated savings Page 8 9 Percentage of MyBottle users Page 10 Summary Page 11 Survey Summary Office of Sophia Sustainability Promotion has installed water servers on campus since 2021 with the aim to promote equal access to safe water and de-plasticization through the use of My Bottle and contribute to achieving SDG 6, 12, 13, and 14. Since the COVID-19 situation eased and restrictions on entering the campus loosened the demand for water servers substantially increased. However, no data measurement had been conducted on the usage and effectiveness of the water servers that were additionally installed from 2022 and onward. Therefore, the Office of Sophia Sustainability Promotion conducted a survey on the frequency of use and the percentage of students who use their own bottles in order to understand the current status of water servers, promote the use of "My Bottle" and take this data into account for future management and improvements. 2
Survey Objective To assess the number of times water servers are used and to improve resource management and efficiency. To evaluate the university's efforts to reduce single-use containers by surveying the number of students who bring their own bottles to campus. This will be useful in formulating future measure. To assess the effectiveness of water servers introduction and the promotion of My Bottle usage in reducing plastic waste on campus To identify the extent of cost savings (beverage costs) for water servers users and encourage their use. To assess the congestion status of water servers and promote the dispersion of usage. Implementation Period Survey on the percentage of respondents who bring their own bottle June 12th(Monday) ~ June 16th(Friday) between 12:30 13:30 Survey on the frequency of use June 19th(Monday) ~ June 23rd(Friday) between 9:00 17:00 3
Survey Method Usage frequency survey by day of the week and location: Counters were set up at 12 water servers on campus, and users were asked to press a button each time they used the water server. Daily usage frequency survey: During one hour of lunch break, we interviewed water server users situated outside of Building No. 2 and Building No. 11 about their daily water server usage frequency. My Bottle water server users: During one hour of lunch break, we recorded the number of water server users who refilled either with MyBottle or PET bottle outside Building No. 2 and Building No. 11. 4
Number of uses per day of the week (total of 12 servers) Number of uses per day of the week 9,000 Day of the week Number of Uses 7,869 7,779 8,000 7,158 Monday 7,158 7,000 6,447 6,174 Tuesday 7,869 6,000 Wednesday 7,779 5,000 4,000 Thursday 6,447 3,000 Friday 6,174 2,000 Total 35,426 1,000 Average 7,085 0 Number of uses Data has been corrected for cases where the counter mistakenly incremented Tues Thu Fri Wed Mon Based on results of survey conducted between from June 19th(Monday) to June 23rd(Friday), the day with the highest number of uses was Tuesday, with 7,869 uses, followed by Wednesday with 7,779 uses, and Monday with 7,158 uses. With this, there were a total of 35,426 uses in one week, averaging to 7,085 uses per day. In simple calculations, dividing the weekly usage frequency of 35,426 uses by the total number of students 14,573, equals 2.43, which means that Sophia University students/faculty uses the water server on average 2.4 times per week. 6
Number of uses per day per location (Average) Location Bld.2 Floor B2 Bld.2 Floor 1 Bld.2 North Gate Side Bld.2 Central Side Bld.2 Floor 3 Library Floor 1 Bld.9 Basement(Left) Bld.9 Basement(Right) Bld.10 Front of Library Bld.10 Near Bld.14 Bld.11 (Left) Bld.11 (Right) No. of Uses 361 1,150 1,285 1,269 1,169 358 66 71 110 329 1,039 685 Number of uses per day per location (Average) 1,400 1,285 1,269 1,169 1,150 1,200 1,039 1,000 800 685 600 361 358 329 400 110 200 71 66 0 Number of Uses Bld.2 Floor B2 Bld.2 Floor 1 2 Bld.2 North Gate 2 2 2 1 2 Bld.2 Central Gate Bld.2 Floor 3 2 3 1 Library Floor 1 9 Bld.9 Basement Left 9 Bld.9 Basement Right 10 Bld.10 Front Library 10 14 Bld.10 Near Bld.14 11 Bld.11 Left 11 Bld.11 Right After a week of investigation, the results indicate that among 12 water servers the most frequently used are Bld.2 North Gate Side (1,285), Bld.2 Central Side (1,269) and Bld.2 Floor 3 (1,169). This suggests that water servers in Building 2 are most frequently used. This is likely due to the absence of water servers in Building 6, which is frequented by many students as well as due to its installation location which is near the main street where many students commute through. 7
Survey on the frequency of uses in one day Frequency of Use per day Frequency of uses in one day No. of People 600 1 Time 480 480 500 2 Times 355 400 355 300 3 Times 166 166 200 4 Times 64 100 64 39 5 Times 39 0 Frequency of Uses Total 1,104 1 1 2 2 3 3 4 4 5 5 Between June 12th(Monday) and June 16th(Friday), during the lunch hour from 12:30 to 13:30, we interviewed 1,104 students who were using the water servers located at Building 11 and Building 2 Central Side, where it was anticipated to have the greatest number of users present. The survey aims to determine the frequency of water server usage in a day among students. The results showed that the majority of users, 480 of them, use the water server once a day, followed by 355 students using it twice a day and 166 students who use it three time a day. 8
Daily Usage Frequency Ratio and Savings Estimations through MyBottle Usage Frequency of Use per day *1 Week Days *1 Year Months Daily Usage Frequency Ratio 1 Day 1 Month 3.5% 5.8% 1 Time 90 450 1,800 14,400 15.0% 2 Times 180 900 3,600 28,800 43.5% 3 Times 270 1,350 5,400 43,200 32.2% 4 Times 360 1,800 7,200 57,600 5 Times 450 2,250 9,000 72,000 1 1 2 2 3 3 4 4 5 5 *1 week excludes Saturdays and Sundays; 1 year excludes spring break and summer vacation. Looking at the percentages, 43.5% of the students drink water once a day, 32.2% twice a day, and 24.3% three or more times a day. Assuming that students who bring their own water bottles can save the cost of purchasing a bottled water (90 yen) per water refill, simple calculations show the students who use the water server once per day can save 90 yen a day, 450 yen a week, 1,800 yen a month, or 14,400 yen a year. With the saving estimations increasing with increased frequency of use. 9
Percentage of users bringing their MyBottles Bld.2 Central Side Bld.11 (Left & Right) MyBottle Users PET Bottle Users Percentage of MyBottle Users MyBottle Users PET Bottle Users TotalPercentage of MyBottle Users Day Total Day Monday 25 59 84 29.8% Monday 52 64 116 44.8% Tuesday 98 51 149 65.8% Tuesday 108 73 181 59.7% Wednesd ay Wednesd ay 38 63 101 37.6% 50 34 84 59.5% Thursday 65 45 110 59.1% Thursday 64 44 108 59.3% Friday 68 51 119 57.1% Friday 68 36 104 65.4% 294 269 563 52.2% 342 251 593 57.7% Total From June 12 (Mon.) to June 16 (Fri.), during a one-hour period from 12:30 to 13:30, we measured the number of people who used their MyBottle at the two water servers located in the pilotis of Building No. 11 and one in the central area outside Building No. 2, where the number of users was expected to be highest. On most days of the week, more than 50% of the respondents used their own bottles (MyBottle). Other days, the number of users refilled with empty bottles (repeated use), which is thought to be contributing to the reduction of plastic bottle waste. 10
Summary Simple calculation, 35,426 times use per week / 14,573 total students = 2.43 times, which means that Sophia students use the water server about 2.4 times per week. The most used area out of the 12 water servers is Building No. 2 North Gate with 1,285 times/day, followed by Building No. 2 Central area with 1,269 times/day, and Building No. 2 third floor with 1,169 times/day. According to the survey, the majority of students (480) uses the water server once a day, followed by 355 who used it twice a day, and 166 who used it three times a day. The results of the survey showed that students who use the water server once a day can save approximately 90 yen a day, 450 yen a week, 1,800 yen a month, and 14,400 yen a year. The percentage of students who used their MyBottles for water refill exceeded 50% on almost all days of the week. 11
For inquiries regarding this material, please contact : Office of Sophia Sustainability Promotion ossp@ml.sophia.ac.jp
