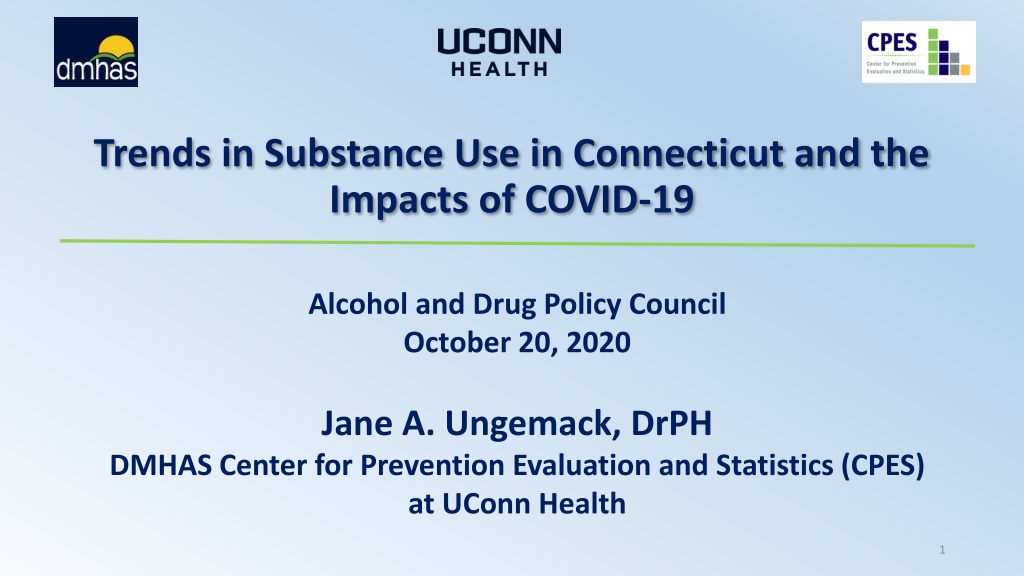
Trends in Substance Use in Connecticut: Impacts of COVID-19
Examining trends in substance use in Connecticut, this report analyzes the percentages of persons reporting alcohol, tobacco, marijuana, and other drug use from 2005 to 2019. It also delves into the effects of COVID-19 on substance use patterns among different age groups, including youth, adults, and high school students. Additionally, the document discusses tobacco sales to youth in Connecticut from 2008 to 2018.

Download Presentation

Please find below an Image/Link to download the presentation.
The content on the website is provided AS IS for your information and personal use only. It may not be sold, licensed, or shared on other websites without obtaining consent from the author. Download presentation by click this link. If you encounter any issues during the download, it is possible that the publisher has removed the file from their server.
E N D
Presentation Transcript
Trends in Substance Use in Connecticut and the Impacts of COVID-19 Alcohol and Drug Policy Council October 20, 2020 Jane A. Ungemack, DrPH DMHAS Center for Prevention Evaluation and Statistics (CPES) at UConn Health 1
Percent of Persons Reporting Use by Substance, Ages 12 and Older: CT vs. US, 2017-2018 100 90 80 CT US 70 62.1 60 51.4 Percent 50 40 29.2 30 24.5 22.0 19.7 18.5 20 15.5 10 3.9 3.7 2.1 2.1 0.4 0.3 0 Past Month Alcohol Past Month Binge Past Month Tobacco Product Past Year Marijuana Past Year Pain Reliever Misuse Past Year Cocaine Past Year Heroin Drinking 2 Note: Tobacco products include cigarettes, smokeless tobacco (i.e., snuff, dip, chewing tobacco, or snus), cigars, or pipe tobacco Source: NSDUH, 2018
Percent of Youth and Adults Reporting Past Month Alcohol Use and Binge Drinking: Connecticut, 2008-2018 100 90 80 70.9 68.9 68.8 68.4 68.0 67.4 67.2 67.0 66.5 70 65.6 66.7 66.1 65.6 65.3 64.8 64.7 64.7 60 63.3 63.1 63.0 48.8 48.0 47.3 47.0 47.0 46.9 50 46.1 44.5 42.2 40 28.9 27.8 30 26.4 26.2 24.8 24.6 24.6 22.7 22.6 18.6 17.8 17.6 16.8 20 14.2 13.6 12.8 12.6 11.4 11.2 10 13.3 11.2 10.2 8.1 7.5 6.4 6.3 6.2 6.1 0 2008-09 2009-10 2010-11 2011-12 2012-13 2013-14 2014-15 2015-16 2016-17 2017-18 12-17 Alcohol Use 18-25 Alcohol Use 26+ Alcohol Use 12-17 Binge Drinking 18-25 Binge Drinking 26+ Binge Drinking 3 Source: NSDUH Note: The 2015 NSDUH underwent significant redesigns. In 2015 the threshold for binge drinking changed for women from 5 to 4
Percent of High School Students Reporting Past 30-Day Alcohol Use and Binge Drinking: Connecticut, 2005-2019 100 90 80 70 60 50 45.3 44.7 43.5 41.5 36.7 40 30.4 30.2 27.8 26.2 25.9 30 24.2 22.3 20.8 20 14.9 14.2 12.9 10 0 2005 2007 2009 2011 2013 2015 2017 2019 Alcohol Use Binge Drinking Source: CSHS (CT YRBS)
Past Month Tobacco Product Use by Age Group, Connecticut, 2008-2018 50 45 41.8 41.5 41.3 40 37.7 35.7 35.6 34.1 33.9 35 31.7 30 27.3 24.8 24.6 24.6 24.2 25 22.3 21.6 21.5 21.5 20.6 20.3 20 15 11 10.8 10.1 8.4 10 6.9 6.8 6.4 5.4 4.1 3.5 5 0 2008-2009 2009-2010 2010-2011 2011-2012 2012-2013 2013-2014 2014-2015 2015-2016 2016-2017 2017-2018 CT 12-17 CT 18-25 CT 26+ Note: Tobacco product use includes cigarettes, smokeless tobacco (i.e., snuff, dip, chewing tobacco, or snus), cigars, or pipe tobacco. Source: NSDUH 5
Tobacco Sales to Youth in Connecticut: SYNAR, CDC & DMHAS, 2008-2018 25 20 Reported Retailer Violation Rate 14.8 15 14.0 13.7 13.3 13.3 12.1 11.3 10.7 9.7 10 9.0 8.8 5 0 2008 2009 2010 2011 2012 2013 2014 2015 2016 2017 2018
Percent of High School Students Reporting Past 30-Day Use of Electronic Vapor Products vs. Cigarettes: Connecticut, 2011-2019 50 45 40 35 30 27 Percent 25 20 14.7 14 15 8.9 10 7.2 5.3 3.7 3.5 5 2.4 5.6 0 2011 2013 2015 2017 2019 Electronic Vapor Products Cigarettes Source: CSHS (CT YRBS) Note: The language around electronic vapor products has changed over the years. In 2017 and earlier, the survey asked about current e-cigarette use rather than vapor products.
Substances Used by E-cigarette Users in Vaping Devices Reported by Young Adults 18-25: Connecticut, 2020 100% N = 452 90% 80% 70% 59% 58% 60% 51% 50% 40% 30% 23% 20% 10% 2% 0% Flavored Liquids Nicotine THC/Marijuana Oils CBD/hemp oil Other Source: Young Adults Statewide Survey 8
Past Year Marijuana Use by Age Group: CT vs. US, 2008-2018 50 46.4 45.2 43.5 45 42.1 39.4 39.0 39.0 38.8 40 37.1 36.9 35.4 34.8 33.9 35 32.6 32.1 31.8 31.6 31.1 30.4 30.4 29.3 30 25 20 16.8 16.3 16.2 16.0 15.9 16.1 14.2 15.7 15.6 14.7 15.2 14.1 15 14.1 13.9 13.8 13.5 13.4 13.3 12.2 12.9 11.4 12.7 12.3 13.2 12.5 9.7 11.7 9.4 9.3 9.8 9.2 10.7 10.6 10 8.3 11.6 10.3 9.6 8.9 8.3 8.0 7.9 7.4 5 0 2008-2009 2009-2010 2010-2011 2011-2012 2012-2013 2013-2014 2014-2015 2015-2016 2016-2017 2017-2018 2019 US 12-17 US 18-25 US 26+ Source: NSDUH, 2018 CT 12-17 CT 18-25 CT 26+
Percent of Persons Perceiving Great Risk from Smoking Marijuana Once a Month by Age Group: Connecticut, 2009-2018 50 45 40 34.9 35 32.7 28.3 28.1 30 26.9 25.7 23.9 22.1 25 23.5 24.7 23.1 23.0 22.4 18.3 20 21.8 20.6 15.4 13.3 15 12.4 12.3 11.7 11.3 10.4 9.3 10 5 0 2009-2010 2010-2011 2011-2012 2012-2013 2013-2014 2014-2015 2015-2016 2016-2017 2017-2018 12-17 Years 18-25 Years 26 or Older Note: The 2015 NSDUH underwent significant redesigns, including the order of perceived risk questions, affecting comparability. Source: NSDUH
Percent Reporting Past Year Cocaine Use by Age Group: Connecticut, 2009-2018 25 20 Ages 12-17 Ages 18-25 Ages 26 or Older 15 9.1 10 8.4 7.6 6.7 6.7 6.3 6.2 5.7 5.1 5 2.1 1.8 1.6 1.6 1.6 1.5 1.4 1.3 1.2 0.7 1.1 0.6 0.6 0 0.9 0.4 1.0 0.6 0.6 2009-10 2010-11 2011-12 2012-13 2013-14 2014-15 2015-16 2016-17 2017-18 Source: NSDUH, 2018
Cocaine-involved Overdose Death Rate (per 100,000) by 5 CT Community Type, 2012-2019 25 24.3 20 18.8 16.9 15 11.5 11.2 10.7 9.6 9.4 10 8.7 8.8 7.6 7.0 7.2 7.0 7.0 5.2 5.8 5.5 4.2 5 3.8 3.4 3.0 4.0 4.0 3.5 2.4 1.7 2.0 2.4 0.5 2.1 1.6 0.5 1.5 1.4 0.0 2012 1.0 1.0 0.5 0 0.0 2013 2014 2015 2016 2017 2018 2019 Rural Suburban Urban Core Urban Periphery Wealthy Source: Office of the Chief Medical Examiner Note: Death rate by town of residence 12
Percent of Persons Reporting Past Year Non-Medical Use of Pain Relievers, by Age Group: Connecticut, 2009-2018 25 Ages 12-17 Ages 18-25 Ages 26 or Older 20 15 11.1 10.7 9.2 10 8.6 8.5 7.5 7.2 7.0 5.0 4.7 4.5 3.9 4.1 4.1 5 3.8 3.4 2.9 3.4 3.5 3.2 3.3 3.0 2.9 2.3 0 2009-10 2010-11 2011-12 2012-13 2013-14 2015-16 2016-17 2017-18 Source: NSDUH, 2018
Percent of High School Students Reporting Ever Misusing Prescription Pain Medicine: CT vs. US, 2009-2019 50 45 40 35 30 25 20.7 20.2 20 17.8 16.8 14.3 14 15 12 11.1 10.1 10.1 9.6 9.6 10 5 0 2009 2011 2013 2015 2017 2019 US Connecticut Note: The wording of this question has changed over the years. In 2015 the question asked about taking prescription drugs without a prescription, but didn t specify pain medicine. In 2013 and earlier, it asked about taking drugs without a prescription to get high. Source: CSHS (YRBS)
Number of Opioid Prescriptions per Year: Connecticut, 2014-2018 3,000,000 2,625,042 2,602,050 2,510,702 2,500,000 2,161,959 1,960,988 2,000,000 1,500,000 1,000,000 500,000 0 2014 2015 2016 2017 2018 Opioid Prescriptions per Year 15 Source: CPMRS, Department of Consumer Protection
Percent of Persons Reporting Past Year Use of Heroin by Age Group: CT vs. US, 2014-2018 2 1.8 1.6 1.4 1.31 1.21 1.2 1.07 1 0.93 0.8 2019 US 12-17 wasn t reported out due to low precision 0.7 0.64 0.69 0.68 0.64 0.61 0.54 0.6 0.4 0.4 0.3 0.32 0.31 0.3 0.29 0.3 0.2 0.06 0.05 0.1 0.1 0.07 0.07 0.04 0.05 0 2014-15 2015-16 2016-17 2017-18 2019 CT 12-17 CT 18-25 CT 26+ US 12-17 US 18-25 US 26+ Source: NSDUH 16
Number of Opioid-related Emergency Department Visits and Hospital Admissions: Connecticut, 2013-2018 4000 3534 3361 3500 3042 3000 2500 1781 2000 1294 1500 1126 883 765 709 709 686 1000 601 500 0 2013 2014 2015 2016 2017 2018 ED Visits Hospital Admissions Source: CT DPH 17
Number of Overdose Deaths by Year: Connecticut, 2012-2019 1200 1200 1100 1038 1017 1000 979 917 900 800 760 723 700 677 600 558 500 504 479 490 474 463 391 415 400 387 342 355 347 330 290 345 325 300 290 273 242 254 267 255 257 220 200 174 174 173 186 128 157 147 144 139 133 130 127 126 122 100 86 105 49 61 97 78 83 75 37 14 0 2012 2013 2014 2015 2016 2017 2018 2019 Total Deaths Heroin-involved deaths Fentanyl-involved deaths Prescription opioid-involved deaths Cocaine-involved deaths Benzodiazepine-involved deaths Alcohol-involved deaths 18 Source: Office of the Chief Medical Examiner
Multiple Drugs Involved in Opioid Overdose Deaths: CT, 2019 Xylazine, 3% Benzodiazepines, 38% Alcohol , 27% Only 15% of Prescription Opioid- Involved Deaths did not involve other substances Cocaine, 20% Prescription Opioid-Involved Deaths (n=133) Prescription Opioids*, 15% Heroin, 20% Fentanyl, 54% Xylazine, 8% Benzodiazepines, 10% Only 3% of Heroin-Involved Deaths did not involve other substances Alcohol , 26% Heroin-Involved Deaths (n=387) Cocaine, 37% Prescription Opioids*, 7% Heroin, 3% Fentanyl, 88% Xylazine, 7% Benzodiazepines, 22% Fentanyl-Involved Deaths (n=979) Alcohol , 27% Only 17% of Fentanyl-Involved Deaths did not involve other substances Cocaine, 40% Prescription Opioids*, 7% Heroin, 35% Fentanyl, 17% 0% 10% 20% 30% 40% 50% 60% 70% 80% 90% 100% *Prescription opioids include oxycodone, oxymorphone, hydrocodone, hydromorphone and tramadol. Substances that are underlined indicate deaths that involved only that substance (e.g., fentanyl-involved deaths involving only fentanyl and no other substances listed). Source: Office of the Chief Medical Examiner 19
Opioid Overdose Mortality Rate by Age Group: Connecticut, 2012-2019 80.0 72.3 70.0 60.8 60.0 58.9 58.3 55.4 51.1 50.9 50.0 48.3 45.2 44.3 41.8 41.0 40.0 39.5 36.5 32.0 28.6 30.0 30.3 30.0 29.0 27.4 24.9 26.2 23.4 20.0 20.3 19.0 18.7 16.8 14.7 15.6 14.0 12.8 12.4 12.1 11.7 10.7 10.0 9.2 7.9 9.0 7.4 5.3 6.3 4.6 3.2 2.7 2.4 2.3 1.1 0.5 0.0 2012 2013 2014 2015 35-44 2016 2017 >=65 2018 2019 15-24 25-34 45-54 55-64 Source: Office of the Chief Medical Examiner 20
Opioid-involved Overdose Death Rate (per 100,000) by 5 CT Community Type: Connecticut, 2012-2019 60.0 55.3 Rural Suburban Urban Core Urban Periphery Wealthy 50.0 44.1 40.0 36.1 34.8 30.0 29.0 28.4 27.2 26.9 26.4 24.0 23.3 23.2 20.0 18.4 16.5 18.1 18.0 17.5 16.4 16.1 16.0 15.8 15.1 12.9 11.1 10.7 10.7 10.0 9.9 10.0 8.7 9.0 7.5 6.4 5.9 5.4 4.9 4.7 4.4 4.0 3.0 1.0 0.0 2012 2013 2014 2015 2016 2017 2018 2019 Note: Death rate by town of residence Source: Office of the Chief Medical Examiner 21
Opioid Overdose Mortality Rate per 100,000 by Race/Ethnicity: Connecticut, 2012-2019 40.0 35.0 33.8 31.3 31.2 30.0 29.4 29.0 26.6 25.0 23.8 21.7 19.0 21.1 20.0 18.7 16.7 16.5 16.4 15.0 12.8 12.6 10.7 10.7 10.0 10.2 9.9 9.1 8.7 7.6 6.4 5.1 5.9 5.0 4.5 4.4 3.1 3.6 3.3 2.3 0.0 2012 2013 2014 2015 2016 2017 2018 2019 White Black Hispanic Other Source: Office of the Chief Medical Examiner 22
Drug Seizure Submissions by Year: Connecticut, 2014-2019 600 579 568 528 514 491 500 492 485 # of substances submitted to labs 457 452 433 416 471 409 400 394 377 384 371 346 300 245 200 203 100 59 50 25 39 36 32 32 4 28 25 0 2014 2015 2016 2017 2018 2019 All fentanyl-related substances* Fentanyl Heroin Cocaine Methamphetamine Source: US DEA, Diversion Control Division, 2014-2019. Springfield, VA: US Drug Enforcement Administration. Retrieved from: https://www.nflis.deadiversion.usdoj.gov/Resources/NFLISPublicResourceLibrary.aspx *All fentanyl-related substances includes: fentanyl, 4-fluoroisobutyryl fentanyl, acetyl fentanyl, acryl fentanyl, carfentanil, cyclopropyl fentanyl, furanyl fentanyl, U-47700, ANPP, butyryl fentanyl, fluoroisobutyryl fentanyl, methoxyacetyl fentanyl, o-fluoro acryl fentanyl, valeryl fentanyl, p-fluoroisobutyryl fentanyl, and p-fluorobutyryl fentanyl. 23
Problem Substances of Greatest Concern for Age Groups, According to Key Informants: Connecticut, 2020 Problem Gambling 4.8 0.1 0.2 0.5 2.4 Prescription drugs 4.3 100 0.4 1.5 16.5 Heroin/Fentanyl 23.4 90 0.0 23.4 36.6 13.3 Cocaine/Crack 80 0.8 0.2 18.2 70 Percent Reporting 0.9 0.2 Marijuana/Hashish/ THC 24.5 60 4.2 2.0 8.5 Vaping/ENDS 50 3.1 52.2 13.3 40 Tobacco/Cigarettes 1.9 30 48.0 47.7 1.9 Alcohol 20 29.5 15.1 10 0 12-17 years old 18-25 years old 26-65 years old 66 or older Source: Community Readiness Survey 2020
COVID-19 25
Prevalence of Increasing/Initiating Substance Use and Adverse Mental Health Outcomes Associated with COVID-19: US, June 24-30, 2020 100% 90% 80% 75% 70% 66% 60% 52% 52% 50% 45% Prevalence 44% 41% 38% 40% 35% 35% 30% 30% 25% 22% 22% 20% 18% 20% 15% 15% 13% 13% 13% 11% 8% 10% 3% 0% Overall 18-24 yrs 25-44 yrs 45-64 yrs >=65 yrs White non- Hispanic Black non- Hispanic Hispanic, any race Less than high school Professional degree Income <25K Income >=200K Substance Use Initiation or Increase >=1 Adverse Mental or Behavioral Health Symptom Czeisler M , Lane RI, Petrosky E, Wiley JF, Christensen A, Njai R, Weaver MD, Robbins R, Facer-Childs ER, Barger LK, Czeisler CA, Howard ME, Rajaratnam SMW. Mental Health, Substance Use, and Suicidal Ideation During the COVID-19 Pandemic - United States, June 24-30, 2020. MMWR Morb Mortal Wkly Rep. 2020 Aug 14;69(32):1049-1057. doi: 10.15585/mmwr.mm6932a1. PMID: 32790653; PMCID: PMC7440121. 26
Young Adults Statewide Survey Health and behavior indicators that increased as a result of COVID-19 100 85.8% 90 83.2% 80.8% 75.7% 80 Percent of Young Adults Reporting 70 60 50 42.1% 39.3% 40 30 21.9% 20 10 0 Boredom Anxiety Sense of isolation Depression Interpersonal/family conflict Alcohol and/or drug use Gaming/gambling Source: Young Adults Statewide Survey 27
Past Month Substance Use Among Young Adults 18-25: Connecticut, 2020 N = 777 100% 87% 90% 80% 70% 60% 50% 37% 40% 28% 30% 21% 20% 12% 10% 4% 3% 2% 1% 0% alcohol (1+ drinks) heavy alcohol use* cigarettes/ tobacco vape/ e- cigarettes Marijuana/ hashish cocaine heroin/ fentanyl Prescription drugs (non- medical use) OTC meds (non- medical use) *heavy alcohol use: 5 or more drinks on one occasion Source: Young Adults Statewide Survey 28
Suspected Overdoses Since Onset of COVID-19 Impact: Connecticut, 2020 (ODMAP Submissions) http://www.odmap.org/Content/docs/news/2020/ODMAP-Report-June-2020.pdf 29
Overdose Deaths by Month: Connecticut, Jan 2018- July 2020* From Jan-Jul 2020, there were 802 confirmed overdose deaths (with possible additional deaths pending confirmation) +20% compared to Jan-Jul 2019 (n=667) 160 COVID-19 140 135 133 126 123 120 121 121 120 114 106 105 105 104 100 98 98 93 92 92 90 89 89 87 86 83 83 80 81 79 78 78 74 73 There were 770 overdose deaths in the 7-m period of Jun-Dec 2019 (+15%) 63 60 40 20 0 Jan Feb Mar Apr May Jun Jul Aug Sep Oct Nov Dec Jan Feb Mar Apr May Jun Jul Aug Sep Oct Nov Dec Jan Feb Mar Apr May Jun Jul 2019 2020 2018 *Mortality data for 2018 and 2019 from publicly available data from the CT Office of the Medical Examiner (available at https://portal.ct.gov/OCME/Statistics). Data for 2020 is provisional and subject to change, and was obtained from https://portal.ct.gov/-/media/DPH/Injury-Prevention/Opioid-Overdose-Data/August-2020-and- 2019-Drug-Overdose-Deaths-Monthly-Report_Updated-9-17-2020.pdf 30
Substance Use Treatment Admissions by Month: Connecticut, January 2018 - May 2020 7000 COVID-19 6481 6474 6413 6371 62676343 6300 6282 62056089 6198 6032 6023 5997 5968 5852 5821 5798 6000 5661 5583 5288 5184 5442 5444 4931 5344 5000 5087 Admissions 4000 35173441 3000 3019 2000 1000 0 2018 2019 2020 Source: DMHAS 31
For more information, contact Jane Ungemack: For more information, contact Jane Ungemack: ungemack@uchc.edu ungemack@uchc.edu or visit the SEOW Prevention Data Portal at or visit the SEOW Prevention Data Portal at https://preventionportal.ctdata.org/ 32


")


")