Key Findings from 2020 National Survey on Drug Use and Health
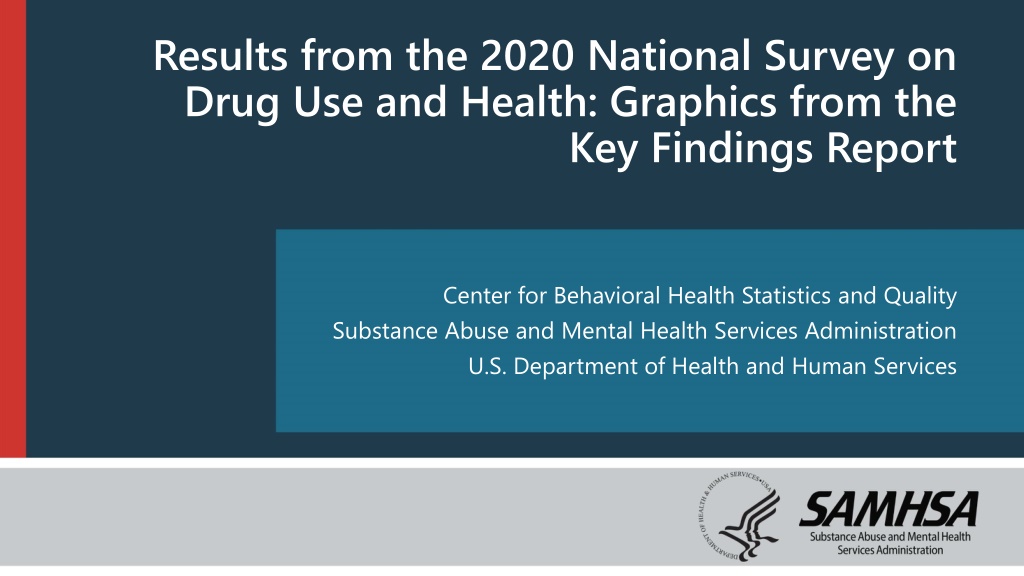
Results from the 2020 National Survey on Drug Use and Health provide insights into past month general substance use, tobacco use, nicotine vaping, and cigarette use among individuals aged 12 or older. The data shows trends from 2002 to 2020, highlighting changes in substance and tobacco consumption patterns. Methodological cautions for comparing estimates between years are emphasized, and specific details on daily cigarette use among past month cigarette smokers aged 12 or older are also presented.

Download Presentation

Please find below an Image/Link to download the presentation.
The content on the website is provided AS IS for your information and personal use only. It may not be sold, licensed, or shared on other websites without obtaining consent from the author. Download presentation by click this link. If you encounter any issues during the download, it is possible that the publisher has removed the file from their server.
E N D
Presentation Transcript
Results from the 2020 National Survey on Drug Use and Health: Graphics from the Key Findings Report Center for Behavioral Health Statistics and Quality Substance Abuse and Mental Health Services Administration U.S. Department of Health and Human Services 1
Past Month General Substance Use and Nicotine Vaping: Among People Aged 12 or Older; 2020 FFR1.1 Rx = prescription. Note: General Substance Use includes any illicit drug, alcohol, and tobacco product use. Tobacco products are defined as cigarettes, smokeless tobacco, cigars, and pipe tobacco. Note: The estimated numbers of current users of different substances are not mutually exclusive because people could have used more than one type of substance in the past month. 2
Past Month Tobacco Use and Nicotine Vaping: Among People Aged 12 or Older; 2020 FFR1.2 Note: The estimated numbers of current users of different tobacco products or nicotine vaping are not mutually exclusive because people could have used more than one type of tobacco product or used tobacco products and vaped nicotine in the past month. 3
Past Month Cigarette Use: Among People Aged 12 or Older; 2002-2020 FFR1.3 Note: There is no connecting line between 2019 and 2020 to indicate caution should be used when comparing estimates between 2020 and prior years because of methodological changes for 2020. Due to these changes, significance testing between 2020 and prior years was not performed. Note: The estimate in 2020 is italicized to indicate caution should be used when comparing estimates between 2020 and prior years because of methodological changes for 2020. Due to these changes, significance testing between 2020 and prior years was not performed. Age 2002 2003 2004 2005 2006 2007 2008 2009 2010 2011 2012 2013 2014 2015 2016 2017 2018 2019 2020 15.0 1.4 13.9 16.7 26.0 13.0 40.8 25.2 25.4 12.2 40.2 24.7 24.9 11.9 39.5 24.1 24.9 10.8 39.0 24.3 25.0 10.4 38.5 24.7 24.3 9.9 36.2 24.1 24.0 9.2 35.7 23.8 23.3 9.0 35.8 23.0 23.0 8.4 34.4 22.8 22.1 7.8 33.5 21.9 22.1 6.6 31.8 22.4 21.3 5.6 30.6 21.6 20.8 4.9 28.4 21.5 19.4 4.2 26.7 20.0 19.1 3.4 23.5 20.2 17.9 3.2 22.3 18.9 17.2 2.7 19.1 18.5 16.7 2.3 17.5 18.2 12 or Older 12 to 17 18 to 25 26 or Older 4
FFR1.4 Daily Cigarette Use: Among Past Month Cigarette Smokers Aged 12 or Older; Smoking of One or More Packs of Cigarettes per Day: Among Current Daily Smokers; 2020 Note: Current daily smokers with unknown data about the number of cigarettes smoked per day were excluded from the pie chart on the right. 5
FFR1.5 Past Month Nicotine Vaping: Among People Aged 12 or Older; 2020 6
Current, Binge, and Heavy Alcohol Use: Among People Aged 12 or Older; 2020 FFR1.6 Note: Binge Alcohol Use is defined as drinking five or more drinks (for males) or four or more drinks (for females) on the same occasion on at least 1 day in the past 30 days. Heavy Alcohol Use is defined as binge drinking on the same occasion on 5 or more days in the past 30 days; all heavy alcohol users are also binge alcohol users. 7
Past Month Binge Alcohol Use: Among People Aged 12 or Older; 2015-2020 FFR1.7 Note: There is no connecting line between 2019 and 2020 to indicate caution should be used when comparing estimates between 2020 and prior years because of methodological changes for 2020. Due to these changes, significance testing between 2020 and prior years was not performed. Note: The estimate in 2020 is italicized to indicate caution should be used when comparing estimates between 2020 and prior years because of methodological changes for 2020. Due to these changes, significance testing between 2020 and prior years was not performed. Age 2015 2016 2017 2018 2019 2020 22.2 4.1 31.4 22.9 24.9 5.8 39.0 24.8 24.2 4.9 38.4 24.2 24.5 5.3 36.9 24.7 24.5 4.7 34.9 25.1 23.9 4.9 34.3 24.5 12 or Older 12 to 17 18 to 25 26 or Older 8
Past Month Heavy Alcohol Use: Among People Aged 12 or Older; 2015-2020 FFR1.8 Note: There is no connecting line between 2019 and 2020 to indicate caution should be used when comparing estimates between 2020 and prior years because of methodological changes for 2020. Due to these changes, significance testing between 2020 and prior years was not performed. Note: The estimate in 2020 is italicized to indicate caution should be used when comparing estimates between 2020 and prior years because of methodological changes for 2020. Due to these changes, significance testing between 2020 and prior years was not performed. Age 2015 2016 2017 2018 2019 2020 6.4 0.6 8.6 6.7 6.5 0.9 10.9 6.4 6.0 0.8 10.1 6.0 6.1 0.7 9.6 6.2 6.1 0.5 9.0 6.2 5.8 0.8 8.4 6.0 12 or Older 12 to 17 18 to 25 26 or Older 9
FFR1.9 Past Year Illicit Drug Use: Among People Aged 12 or Older; 2020 Rx = prescription. Note: The estimated numbers of past year users of different illicit drugs are not mutually exclusive because people could have used more than one type of illicit drug in the past year. 10
Past Year Illicit Drug Use: Among People Aged 12 or Older; 2015-2020 FFR1.10 Note: There is no connecting line between 2019 and 2020 to indicate caution should be used when comparing estimates between 2020 and prior years because of methodological changes for 2020. Due to these changes, significance testing between 2020 and prior years was not performed. Note: The estimate in 2020 is italicized to indicate caution should be used when comparing estimates between 2020 and prior years because of methodological changes for 2020. Due to these changes, significance testing between 2020 and prior years was not performed. Age 2015 2016 2017 2018 2019 2020 21.4 13.8 37.0 19.9 17.8 17.5 37.5 14.6 18.0 15.8 37.7 15.0 19.0 16.3 39.4 16.1 19.4 16.7 38.7 16.7 20.8 17.2 39.1 18.3 12 or Older 12 to 17 18 to 25 26 or Older 11
Past Year Marijuana Use: Among People Aged 12 or Older; 2002-2020 FFR1.11 Note: There is no connecting line between 2019 and 2020 to indicate caution should be used when comparing estimates between 2020 and prior years because of methodological changes for 2020. Due to these changes, significance testing between 2020 and prior years was not performed. Note: The estimate in 2020 is italicized to indicate caution should be used when comparing estimates between 2020 and prior years because of methodological changes for 2020. Due to these changes, significance testing between 2020 and prior years was not performed. Age 2002 2003 2004 2005 2006 2007 2008 2009 2010 2011 2012 2013 2014 2015 2016 2017 2018 2019 2020 17.9 10.1 34.5 16.3 11.0 15.8 29.8 7.0 10.6 15.0 28.5 6.9 10.6 14.5 27.8 7.0 10.4 13.3 28.0 6.9 10.3 13.2 28.1 6.9 10.1 12.5 27.5 6.8 10.4 13.1 27.8 7.0 11.4 13.7 30.8 7.7 11.6 14.0 30.0 8.0 11.5 14.2 30.8 7.9 12.1 13.5 31.5 8.6 12.6 13.4 31.6 9.2 13.2 13.1 31.9 10.1 13.5 12.6 32.2 10.4 13.9 12.0 33.0 11.0 15.0 12.4 34.9 12.2 15.9 12.5 34.8 13.3 17.5 13.2 35.4 15.2 12 or Older 12 to 17 18 to 25 26 or Older 12
Past Year Methamphetamine Use: Among People Aged 12 or Older; 2015-2020 FFR1.12 Note: There is no connecting line between 2019 and 2020 to indicate caution should be used when comparing estimates between 2020 and prior years because of methodological changes for 2020. Due to these changes, significance testing between 2020 and prior years was not performed. Note: The estimate in 2020 is italicized to indicate caution should be used when comparing estimates between 2020 and prior years because of methodological changes for 2020. Due to these changes, significance testing between 2020 and prior years was not performed. Age 2015 2016 2017 2018 2019 2020 0.9 0.1 0.5 1.1 0.6 0.2 0.9 0.6 0.5 0.1 0.8 0.5 0.6 0.2 1.1 0.6 0.7 0.2 0.8 0.7 0.7 0.2 0.8 0.8 12 or Older 12 to 17 18 to 25 26 or Older 13
Past Year Hallucinogen Use: Among People Aged 12 or Older; 2015-2020 FFR1.13 Note: There is no connecting line between 2019 and 2020 to indicate caution should be used when comparing estimates between 2020 and prior years because of methodological changes for 2020. Due to these changes, significance testing between 2020 and prior years was not performed. Note: The estimate in 2020 is italicized to indicate caution should be used when comparing estimates between 2020 and prior years because of methodological changes for 2020. Due to these changes, significance testing between 2020 and prior years was not performed. Age 2015 2016 2017 2018 2019 2020 2.6 1.5 7.3 2.0 1.8 2.1 7.0 0.8 1.8 1.8 6.9 1.0 1.9 2.1 7.0 1.0 2.0 1.5 6.9 1.3 2.2 1.8 7.2 1.5 12 or Older 12 to 17 18 to 25 26 or Older 14
Past Year Inhalant Use: Among People Aged 12 or Older; 2015-2020 FFR1.14 Note: There is no connecting line between 2019 and 2020 to indicate caution should be used when comparing estimates between 2020 and prior years because of methodological changes for 2020. Due to these changes, significance testing between 2020 and prior years was not performed. Note: The estimate in 2020 is italicized to indicate caution should be used when comparing estimates between 2020 and prior years because of methodological changes for 2020. Due to these changes, significance testing between 2020 and prior years was not performed. Age 2015 2016 2017 2018 2019 2020 0.9 2.7 1.5 0.5 0.7 2.7 1.4 0.3 0.6 2.2 1.4 0.3 0.6 2.3 1.6 0.3 0.7 2.7 1.5 0.4 0.8 3.0 1.7 0.4 12 or Older 12 to 17 18 to 25 26 or Older 15
Past Year Prescription Stimulant Misuse: Among People Aged 12 or Older; 2015-2020 FFR1.15 Note: There is no connecting line between 2019 and 2020 to indicate caution should be used when comparing estimates between 2020 and prior years because of methodological changes for 2020. Due to these changes, significance testing between 2020 and prior years was not performed. Note: The estimate in 2020 is italicized to indicate caution should be used when comparing estimates between 2020 and prior years because of methodological changes for 2020. Due to these changes, significance testing between 2020 and prior years was not performed. Age 2015 2016 2017 2018 2019 2020 1.8 1.2 4.8 1.5 2.0 2.0 7.3 1.1 2.1 1.7 7.5 1.3 2.1 1.8 7.4 1.3 1.9 1.5 6.5 1.2 1.8 1.7 5.8 1.2 12 or Older 12 to 17 18 to 25 26 or Older 16
Past Year Prescription Pain Reliever Misuse: Among People Aged 12 or Older; 2015-2020 FFR1.16 Note: There is no connecting line between 2019 and 2020 to indicate caution should be used when comparing estimates between 2020 and prior years because of methodological changes for 2020. Due to these changes, significance testing between 2020 and prior years was not performed. Note: The estimate in 2020 is italicized to indicate caution should be used when comparing estimates between 2020 and prior years because of methodological changes for 2020. Due to these changes, significance testing between 2020 and prior years was not performed. Age 2015 2016 2017 2018 2019 2020 3.3 1.6 4.1 3.4 4.7 3.9 8.5 4.1 4.3 3.5 7.1 3.9 4.1 3.1 7.2 3.7 3.6 2.8 5.5 3.4 3.5 2.3 5.2 3.4 12 or Older 12 to 17 18 to 25 26 or Older 17
FFR1.17 Past Year Prescription Pain Reliever Misuse: Among People Aged 12 or Older; by Selected Pain Reliever Subtype, 2020 * Low precision; no estimate reported. 18
FFR1.18 Source Where Pain Relievers Were Obtained for Most Recent Misuse: Among People Aged 12 or Older Who Misused Pain Relievers in the Past Year; 2020 Note: Respondents with unknown data for the Source for Most Recent Misuse or who reported Some Other Way but did not specify a valid way were excluded. Note: The percentages do not add to 100 percent due to rounding. 19
FFR1.19 Past Year Opioid Misuse: Among People Aged 12 or Older; 2020 20
Past Year Central Nervous System (CNS) Stimulant Misuse: Among People Aged 12 or Older; 2020 FFR1.20 21
Past Year Initiates of Substances: Among People Aged 12 or Older; 2020 FFR1.21 Rx = prescription. Note: Estimates for prescription pain relievers, prescription tranquilizers, prescription stimulants, and prescription sedatives are for the initiation of misuse. 22
Past Year Alcohol Initiates: Among People Aged 12 or Older; 2002-2020 FFR1.22 Note: There is no connecting line between 2019 and 2020 to indicate caution should be used when comparing estimates between 2020 and prior years because of methodological changes for 2020. Due to these changes, significance testing between 2020 and prior years was not performed. Note: The estimate in 2020 is italicized to indicate caution should be used when comparing estimates between 2020 and prior years because of methodological changes for 2020. Due to these changes, significance testing between 2020 and prior years was not performed. Age 2002 2003 2004 2005 2006 2007 2008 2009 2010 2011 2012 2013 2014 2015 2016 2017 2018 2019 2020 4.1 1.8 2.1 0.2 3.9 2.6 1.2 0.1 4.1 2.6 1.4 0.1 4.4 2.7 1.5 0.2 4.3 2.7 1.4 0.1 4.4 2.7 1.6 0.1 4.6 2.7 1.7 0.1 4.5 2.6 1.7 0.2 4.6 2.7 1.8 0.1 4.7 2.5 2.0 0.2 4.7 2.6 2.0 0.1 4.6 2.4 1.9 0.2 4.6 2.4 2.1 0.1 4.7 2.3 2.2 0.1 4.8 2.4 2.2 0.2 4.6 2.3 2.2 0.2 4.9 2.3 2.4 0.1 4.9 2.4 2.4 0.1 4.9 2.3 2.4 0.2 12 or Older 12 to 17 18 to 25 26 or Older 23
Past Year Marijuana Initiates: Among People Aged 12 or Older; 2002-2020 FFR1.23 Note: Estimates of less than 0.05 million round to 0.0 million when shown to the nearest tenth of a million. Note: There is no connecting line between 2019 and 2020 to indicate caution should be used when comparing estimates between 2020 and prior years because of methodological changes for 2020. Due to these changes, significance testing between 2020 and prior years was not performed. Note: The estimate in 2020 is italicized to indicate caution should be used when comparing estimates between 2020 and prior years because of methodological changes for 2020. Due to these changes, significance testing between 2020 and prior years was not performed. Age 2002 2003 2004 2005 2006 2007 2008 2009 2010 2011 2012 2013 2014 2015 2016 2017 2018 2019 2020 2.8 1.0 1.1 0.7 2.2 1.4 0.7 0.1 2.0 1.2 0.7 0.1 2.1 1.3 0.7 0.2 2.1 1.1 0.7 0.3 2.1 1.2 0.7 0.1 2.1 1.2 0.8 0.1 2.2 1.2 0.8 0.2 2.4 1.3 1.0 0.0 2.4 1.3 0.9 0.2 2.6 1.4 1.1 0.2 2.4 1.3 1.0 0.2 2.4 1.2 1.0 0.2 2.6 1.2 1.1 0.3 2.6 1.2 1.0 0.4 2.6 1.2 1.0 0.4 3.0 1.2 1.3 0.5 3.1 1.3 1.2 0.5 3.5 1.4 1.2 0.9 12 or Older 12 to 17 18 to 25 26 or Older 24
Past Year Prescription Pain Reliever Misuse Initiates: Among People Aged 12 or Older; 2015-2020 FFR1.24 Note: There is no connecting line between 2019 and 2020 to indicate caution should be used when comparing estimates between 2020 and prior years because of methodological changes for 2020. Due to these changes, significance testing between 2020 and prior years was not performed. Note: The estimate in 2020 is italicized to indicate caution should be used when comparing estimates between 2020 and prior years because of methodological changes for 2020. Due to these changes, significance testing between 2020 and prior years was not performed. Age 2015 2016 2017 2018 2019 2020 1,223 158 290 774 2,126 415 596 1,114 2,139 423 585 1,130 2,010 316 465 1,229 1,908 310 464 1,134 1,607 245 404 958 12 or Older 12 to 17 18 to 25 26 or Older 25
Perceived Great Risk from Substance Use: Among People Aged 12 or Older; 2015-2020 FFR1.25 Note: There is no connecting line between 2019 and 2020 to indicate caution should be used when comparing estimates between 2020 and prior years because of methodological changes for 2020. Due to these changes, significance testing between 2020 and prior years was not performed. Note: The estimate in 2020 is italicized to indicate caution should be used when comparing estimates between 2020 and prior years because of methodological changes for 2020. Due to these changes, significance testing between 2020 and prior years was not performed. Substance Use 2015 2016 2017 2018 2019 2020 36.3 87.4 94.2 68.7 72.8 34.0 87.1 94.1 68.3 72.8 31.9 86.8 94.5 68.9 71.6 30.6 86.5 94.3 68.5 71.8 29.2 85.7 93.8 67.9 71.2 27.4 84.7 93.2 68.7 70.7 Smoking Marijuana Once or Twice a Week Using Cocaine Once or Twice a Week Using Heroin Once or Twice a Week Having 4 or 5 Drinks of Alcohol Nearly Every Day Smoking One or More Packs of Cigarettes per Day 26
Substance Use Disorder, Alcohol Use Disorder, and Illicit Drug Use Disorder in the Past Year: Among People Aged 12 or Older; 2020 FFR1.26 27
People Aged 12 or Older with a Past Year Substance Use Disorder (SUD); 2020 FFR1.27 Note: The estimated numbers of people with substance use disorders are not mutually exclusive because people could have use disorders for more than one substance. 28
FFR1.28 Alcohol Use Disorder (AUD) and Illicit Drug Use Disorder (IDUD) in the Past Year: Among People Aged 12 or Older with a Past Year Substance Use Disorder (SUD); 2020 29
Marijuana Use Disorder, Pain Reliever Use Disorder, and Methamphetamine Use Disorder in the Past Year: Among People Aged 12 or Older; 2020 FFR1.29 30
FFR1.30 Major Depressive Episode (MDE) and MDE with Severe Impairment in the Past Year: Among Youths Aged 12 to 17; 2004-2020 N/A = not available. Note: There is no connecting line between 2019 and 2020 to indicate caution should be used when comparing estimates between 2020 and prior years because of methodological changes for 2020. Due to these changes, significance testing between 2020 and prior years was not performed. Note: The estimate in 2020 is italicized to indicate caution should be used when comparing estimates between 2020 and prior years because of methodological changes for 2020. Due to these changes, significance testing between 2020 and prior years was not performed. MDE Status 2004 2005 2006 2007 2008 2009 2010 2011 2012 2013 2014 2015 2016 2017 2018 2019 2020 17.0 9.0 8.8 7.9 8.2 8.3 8.1 8.0 8.2 9.1 10.7 11.4 12.5 12.8 13.3 14.4 15.7 MDE MDE with Severe Impairment N/A N/A 5.5 5.5 6.0 5.8 5.7 5.7 6.3 7.7 8.2 8.8 9.0 9.4 10.0 11.1 12.0 31
Major Depressive Episode with Severe Impairment in the Past Year: Among Adults Aged 18 or Older; 2009-2020 FFR1.31 Note: There is no connecting line between 2019 and 2020 to indicate caution should be used when comparing estimates between 2020 and prior years because of methodological changes for 2020. Due to these changes, significance testing between 2020 and prior years was not performed. Note: The estimate in 2020 is italicized to indicate caution should be used when comparing estimates between 2020 and prior years because of methodological changes for 2020. Due to these changes, significance testing between 2020 and prior years was not performed. Age 2009 2010 2011 2012 2013 2014 2015 2016 2017 2018 2019 2020 6.0 12.1 6.5 3.8 4.0 5.2 4.8 2.6 4.2 5.2 4.7 3.5 4.2 5.2 5.2 2.9 4.5 5.8 5.1 3.4 4.3 5.7 4.9 3.2 4.3 6.0 4.6 3.5 4.3 6.5 4.9 3.0 4.3 7.0 4.7 3.0 4.5 8.5 5.0 2.8 4.7 8.9 5.3 2.9 5.3 10.3 6.1 3.2 18 or Older 18 to 25 26 to 49 50 or Older 32
Serious Mental Illness in the Past Year: Among Adults Aged 18 or Older; 2008-2020 FFR1.32 Note: There is no connecting line between 2019 and 2020 to indicate caution should be used when comparing estimates between 2020 and prior years because of methodological changes for 2020. Due to these changes, significance testing between 2020 and prior years was not performed. Note: The estimate in 2020 is italicized to indicate caution should be used when comparing estimates between 2020 and prior years because of methodological changes for 2020. Due to these changes, significance testing between 2020 and prior years was not performed. Age 2008 2009 2010 2011 2012 2013 2014 2015 2016 2017 2018 2019 2020 3.7 3.8 4.8 2.5 3.7 3.3 4.9 2.5 4.1 3.9 5.2 3.0 3.9 3.8 5.0 2.8 4.1 4.1 5.2 3.0 4.2 4.2 5.3 3.2 4.1 4.8 4.9 3.1 4.0 5.0 5.0 2.8 4.2 5.9 5.3 2.7 4.5 7.5 5.6 2.7 4.6 7.7 5.9 2.5 5.2 8.6 6.8 2.9 5.6 9.7 6.9 3.4 18 or Older 18 to 25 26 to 49 50 or Older 33
Past Year Substance Use Disorder (SUD) and Major Depressive Episode (MDE): Among Youths Aged 12 to 17; 2020 FFR1.33 Note: Youth respondents with unknown MDE data were excluded. 34
Substance Use: Among Youths Aged 12 to 17; by Past Year Major Depressive Episode (MDE) Status, 2020 FFR1.34 +Difference between this estimate and the estimate for youths without MDE is statistically significant at the .05 level. Note: Youth respondents with unknown MDE data were excluded. 35
Past Year Substance Use Disorder (SUD) and Any Mental Illness (AMI): Among Adults Aged 18 or Older; 2020 FFR1.35 36
Past Year Substance Use Disorder (SUD) and Serious Mental Illness (SMI): Among Adults Aged 18 or Older; 2020 FFR1.36 37
Substance Use: Among Adults Aged 18 or Older; by Mental Illness Status, 2020 FFR1.37 + Difference between this estimate and the estimate for adults without mental illness is statistically significant at the .05 level. 38
Adults Aged 18 or Older with Serious Thoughts of Suicide, Suicide Plans, or Suicide Attempts in the Past Year; 2020 FFR1.38 39
Had Serious Thoughts of Suicide, Made a Suicide Plan, or Attempted Suicide in the Past Year: Among Adults Aged 18 or Older; 2020 FFR1.39 40
Youths Aged 12 to 17 with Serious Thoughts of Suicide, Suicide Plans, or Suicide Attempts in the Past Year; 2020 FFR1.40 41
Need for Substance Use Treatment in the Past Year: Among People Aged 12 or Older; 2020 FFR1.41 42
Locations Where Substance Use Treatment in the Past Year Was Received: Among People Aged 12 or Older; 2020 FFR1.42 Note: Locations where people received substance use treatment are not mutually exclusive because respondents could report that they received treatment in more than one location in the past year. 43
FFR1.43 Received Any Substance Use Treatment in the Past Year: Among People Aged 12 or Older Who Had a Substance Use Disorder in the Past Year; 2020 44
FFR1.44 Received Substance Use Treatment at a Specialty Facility in the Past Year: Among People Aged 12 or Older Who Needed Substance Use Treatment in the Past Year; 2020 45
Perceived Need for Substance Use Treatment: Among People Aged 12 or Older with a Past Year Substance Use Disorder (SUD) Who Did Not Receive Substance Use Treatment at a Specialty Facility in the Past Year; 2020 FFR1.45 Note: People who had an SUD were classified as needing substance use treatment. Note: The percentages do not add to 100 percent due to rounding. 46
FFR1.46 Received Treatment in the Past Year for Depression: Among Youths Aged 12 to 17 with a Past Year Major Depressive Episode (MDE) or MDE with Severe Impairment; 2004-2020 N/A = not available. Note: There is no connecting line between 2019 and 2020 to indicate caution should be used when comparing estimates between 2020 and prior years because of methodological changes for 2020. Due to these changes, significance testing between 2020 and prior years was not performed. Note: The estimate in 2020 is italicized to indicate caution should be used when comparing estimates between 2020 and prior years because of methodological changes for 2020. Due to these changes, significance testing between 2020 and prior years was not performed. MDE Status 2004 2005 2006 2007 2008 2009 2010 2011 2012 2013 2014 2015 2016 2017 2018 2019 2020 41.6 40.3 37.8 38.8 39.0 37.7 34.6 37.8 38.4 37.0 38.1 41.2 39.3 40.9 41.5 41.4 43.3 MDE MDE with Severe Impairment 46.9 N/A N/A 46.5 43.9 42.6 38.8 41.1 43.5 41.0 45.0 44.7 44.6 46.7 47.5 46.9 49.7 47
FFR1.47 Received Treatment in the Past Year for Depression: Among Adults Aged 18 or Older with a Past Year Major Depressive Episode; 2009-2020 Note: There is no connecting line between 2019 and 2020 to indicate caution should be used when comparing estimates between 2020 and prior years because of methodological changes for 2020. Due to these changes, significance testing between 2020 and prior years was not performed. Note: The estimate in 2020 is italicized to indicate caution should be used when comparing estimates between 2020 and prior years because of methodological changes for 2020. Due to these changes, significance testing between 2020 and prior years was not performed. Age 2009 2010 2011 2012 2013 2014 2015 2016 2017 2018 2019 2020 66.0 57.6 64.8 75.3 64.3 47.0 64.8 73.8 68.2 48.7 68.1 78.4 68.1 47.8 68.1 80.0 68.0 49.8 68.8 76.8 68.6 50.8 66.7 81.3 68.6 49.5 67.9 80.8 67.2 46.8 67.4 80.9 65.3 44.1 67.4 77.3 66.8 50.7 67.3 79.7 64.8 49.6 64.4 78.9 66.3 50.9 68.9 76.5 18 or Older 18 to 25 26 to 49 50 or Older 48
Sources of Mental Health Services in the Past Year: Among Youths Aged 12 to 17; 2002-2020 FFR1.48 N/A = not available. Note: There is no connecting line between 2019 and 2020 to indicate caution should be used when comparing estimates between 2020 and prior years because of methodological changes for 2020. Due to these changes, significance testing between 2020 and prior years was not performed. Note: The estimate in 2020 is italicized to indicate caution should be used when comparing estimates between 2020 and prior years because of methodological changes for 2020. Due to these changes, significance testing between 2020 and prior years was not performed. Source 2002 2003 2004 2005 2006 2007 2008 2009 2010 2011 2012 2013 2014 2015 2016 2017 2018 2019 2020 11.8 N/A 2.7 N/A N/A 12.4 N/A 2.9 N/A N/A 13.4 N/A 3.4 N/A N/A 13.4 N/A 3.2 N/A N/A 13.0 N/A 2.8 N/A N/A 12.4 N/A 2.8 N/A N/A 12.7 N/A 2.9 N/A N/A 12.0 12.1 2.5 0.4 0.4 12.1 12.4 2.5 0.4 0.3 12.6 11.9 2.5 0.6 0.4 12.7 12.9 2.5 0.4 0.3 13.6 13.0 2.8 0.4 0.2 13.7 13.2 2.9 0.4 0.3 13.3 13.2 2.7 0.3 0.2 14.7 13.1 2.9 0.4 0.2 14.8 13.3 3.3 0.4 0.2 16.0 14.2 3.1 0.4 0.2 16.7 15.4 3.7 0.4 0.2 17.3 12.8 3.1 0.3 0.1 Specialty Mental Health Setting Education Setting General Medical Setting Child Welfare Setting Juvenile Justice Setting 49
Type of Mental Health Services Received in the Past Year: Among Adults Aged 18 or Older; 2002-2020 FFR1.49 Note: Mental Health Services include any combination of inpatient or outpatient services or receipt of prescription medication. Note: There is no connecting line between 2019 and 2020 to indicate caution should be used when comparing estimates between 2020 and prior years because of methodological changes for 2020. Due to these changes, significance testing between 2020 and prior years was not performed. Note: The estimate in 2020 is italicized to indicate caution should be used when comparing estimates between 2020 and prior years because of methodological changes for 2020. Due to these changes, significance testing between 2020 and prior years was not performed. Service Type 2002 2003 2004 2005 2006 2007 2008 2009 2010 2011 2012 2013 2014 2015 2016 2017 2018 2019 2020 13.0 0.7 7.4 10.5 13.2 0.8 7.1 10.9 12.8 0.9 7.1 10.5 13.0 1.0 6.8 10.7 12.9 0.7 6.7 10.9 13.3 1.0 7.0 11.2 13.5 0.9 6.8 11.4 13.4 0.8 6.4 11.3 13.8 0.8 6.6 11.7 13.6 0.8 6.7 11.5 14.5 0.8 6.6 12.4 14.6 0.9 6.6 12.5 14.8 1.0 6.7 12.6 14.2 0.9 7.1 11.8 14.4 0.9 6.9 12.0 14.8 1.0 7.5 12.1 15.0 1.0 7.9 12.2 16.1 1.0 8.3 13.1 16.9 0.9 8.8 13.8 Mental Health Services Inpatient Outpatient Prescription Medication 50


 Stimulant Misuse:")


 and Major Depressive")

 and Any Mental")
 and Serious Mental")