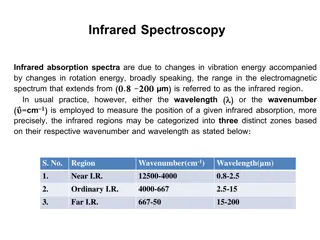
Vibration Response Spectrum Analysis for SDOF Systems
This article covers the calculation of the Vibration Response Spectrum for Single-Degree-of-Freedom (SDOF) systems subjected to base excitation using a general method equation. It explains how to determine the response for a family of natural frequencies and plot the results as VRS. The content includes information on power spectral density, response acceleration values, and GRMS values for response curves. Practical examples and visual aids are provided to help understand the concepts better.

Download Presentation

Please find below an Image/Link to download the presentation.
The content on the website is provided AS IS for your information and personal use only. It may not be sold, licensed, or shared on other websites without obtaining consent from the author. Download presentation by click this link. If you encounter any issues during the download, it is possible that the publisher has removed the file from their server.
E N D
Presentation Transcript
Unit 16 Vibrationdata General Method for Calculating the Vibration Response Spectrum 1
SDOF System, Base Excitation Vibrationdata The natural frequency fn is 1 k m = fn 2 Determine the response of a single-degree-of-freedom system subjected to base excitation, where the excitation is in the form of a power spectral density. Do this for a family of natural frequencies. Plot results as Vibration Response Spectrum (VRS). 2
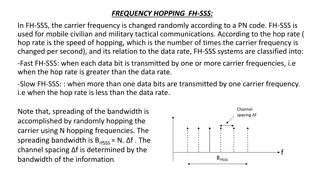
General Method Equation Vibrationdata Recall that he general method gives a more accurate response value than the Miles equation. N = 2 + ( ) 1 2 ( ) Y = i x f , f ( ) f , GRMS n A PSD i i 2 2 2 + 1 2 i 1 i i = f f / i i n where f is the base excitation frequency and fn is the natural frequency 3
Frequency (Hz) 20 Accel (G^2/Hz) 0.0053 150 0.04 600 0.04 2000 0.0036 Consider the base input vibration test level from MIL-STD-1540B. This level is used to test avionics components on shaker tables. Array name: MILSTD1540B_ATP.txt 4
Use: vibrationdata > power spectral density > SDOF Response to Base Input Save each response (Duration does not affect these curves) Plot family of curves using: vibrationdata > Miscellaneous Functions > Plot Utilities > Multiple Curves 5
GRMS Values for Response Curves Vibrationdata Vibration Response Spectrum Q=10 Natural Frequency (Hz) Response Acceleration (GRMS) 100 6.4 200 11.1 300 13.7 6
13.7 G 11.1 G 6.4 G vibrationdata > Power Spectral Density > Vibration Response Spectrum (VRS) Base Input is the MIL-STD1540B level. Duration is 60 seconds. 7
PSD Arrays: flight_data.psd test_spec.psd 330 Hz 872 Hz Actual Case History The accelerometer was mounted near the component in flight. The component natural frequency is unknown. Was the component under- tested? Plot family of curves using: vibrationdata > Miscellaneous Functions > Plot Utilities > Multiple Curves 8
Vibrationdata VRS Calculation Calculate VRS for both flight_data & test_spec Duration = 60 seconds (but does not matter for this calculation) Save each VRS, 1-sigma (1-sigma = GRMS for zero mean) Plot the two VRS curves using: vibrationdata > Miscellaneous Functions > Plot Utilities > Multiple Curves 9
Assumptions: SDOF Response, Q=10 Both PSDs are stationary with normal distribution. PSD Durations: Test > Flight The SDOF response to the Test Spec is greater than that of the Flight Data across all natural Frequencies, with margin to spare. So the component was not under-tested! 10
Vibrationdata Flight Accelerometer Data Python array name: sub_bulkhead.txt Task: Derive a simplified envelope using four coordinates. This envelope will then be used to specify a design and test level after uncertainty margin has been added. 11
Vibrationdata Envelope Derivation, Method 1 Dark red line is a candidate envelope. Overall level = 10.3 GRMS Too Conservative! 12
Vibrationdata Envelope Derivation Method Allow the envelope PSD to clip the flight data peaks as long as the envelope VRS meets or exceeds the flight data VRS Use trial-and-error to derive the least possible PSD which meets the VRS requirement This only cover GRMS response fatigue will be covered in a future Webinar Python >> vibrationdata > Power Spectral Density > Envelope PSD via VRS 13
Vibrationdata PSD Comparison Envelope Frequency (Hz) Accel (G^2/Hz) 20 0.0018 222 0.081 474 0.081 2000 0.010 The Envelope allows for peak clipping. 14
Vibrationdata VRS Comparison Assumptions: SDOF Response, Q=10 Both PSDs are stationary with normal distribution. PSD Durations: Envelope > Input The Envelope is greater than or equal to the Flight Data Input across all natural frequencies. 15
Conclusions Vibrationdata The Vibration Response Spectrum (VRS) is a useful tool for comparing the effects of different PSDs on a SDOF system, where the natural frequency and amplification factors are independent variables The VRS can be used to determine whether a component previously tested to one PSD specification needs to be re-testing for a new specification The VRS can be used for deriving envelopes for measured PSDs The VRS will be extended to fatigue damage in future webinars 16