Building an Engaging Presentation Together
Let's collaborate on creating an outstanding presentation using various tools and features. Learn how to access the Presentation and Slide Library, insert SmartObjects, utilize Elements for design, add Infographics and DataMaps, and automate tasks expertly. Follow the step-by-step instructions provided to enhance your presentation skills and impress your audience.
Download Presentation

Please find below an Image/Link to download the presentation.
The content on the website is provided AS IS for your information and personal use only. It may not be sold, licensed, or shared on other websites without obtaining consent from the author. Download presentation by click this link. If you encounter any issues during the download, it is possible that the publisher has removed the file from their server.
E N D
Presentation Transcript
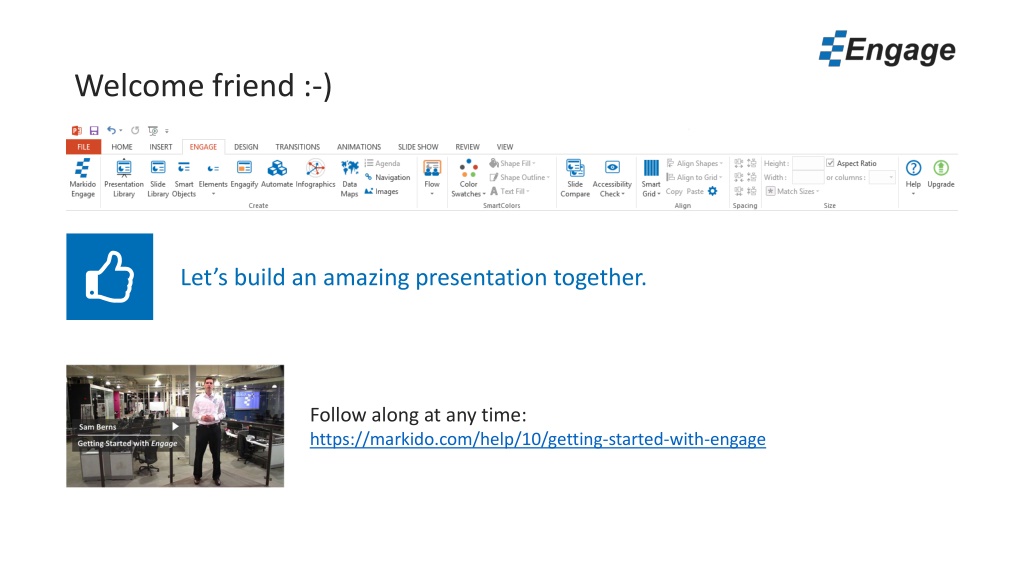
Welcome friend :-) Let s build an amazing presentation together. Follow along at any time: https://markido.com/help/10/getting-started-with-engage
Presentation and Slide Library Instructions Beginner Watch Video 1. Click the Presentation Library button from the Engage tab. 2. Select Business Case and click the Open button. 3. Click on the Slide Library button from the Engage tab. 4. Select any slide and click on the Insert button.
SmartObjects Insert SmartObject here Instructions Beginner Watch Video 1. Click the SmartObjects button in the Engage tab. 2. This will open the SmartObjects task pane. Partnerships Cost Leadership Differentiation Intellectual Property 3. Drag and drop the 4 Boxes SmartObject onto this slide. Up to 30% lower purchase price than the most popular thermostat currently being sold. The only programmable thermostat that doesn t require programing. There are currently two pending patents for this technology. Distribution deals with the three largest retailers in the United States and Canada. 4. Close the SmartObjects task pane when finished.
Elements Instructions Beginner Watch Video 1. Click the Elements button from the Engage tab. 2. Drag and drop an icon on the empty circles above. 3. Select the icon, resize and change the shape fill color the way you would any PowerPoint shape. 4. Find more design elements from the Element drop-down menu (e.g. Flowcharts, Wireframes, Callouts, Calendar and Charts).
Infographics Insert pictogram infographic here Insert doughnut chart infographic here of people keep their phone beside their bed 78% 83% Instructions Intermediate Watch Video 1. Click the Infographics button from the Engage tab. 2. Select the Doughnut infographic and click the Insert button. 83% of PowerPoint users wish they could create better visuals. 3. Change the Value % to 83% and close the dialog window. 4. Try doing the same with the Pictogram but this time click on Edit Data to update the values. 5. Select the infographic and click on the gears on the top right to reopen the infographic dialog window at any time.
DataMaps Results by Country Insert DataMap here Instructions Intermediate Watch Video 1. Click the DataMaps button from the Engage tab. 2. Select the North America by Country map. Map data 3. Click on Edit Data to update the values in Excel, then close the Excel file. 200 4. Click on the Legend button. 5. Check the Show Legend box and close the dialog box. 65
Automate Instructions Expert Watch Video Project Budget 2000000 1. Open a new Excel spreadsheet. 2. Type a number (e.g. $4,500,000) in any cell. 3. Type a percentage (e.g. 89%) in any cell. Project Completion 4. Copy the data from the table here into Excel 71% 5. Save and Close the Excel file. 6. Click the automate button and select the Microsoft Excel option. 7. Click the Create a link button. Activities Year 1 Year 2 8. Select the text box with the value 2000000 and click Link Selected Shape. Planning $200,000 $100,000 9. Select the Excel file above and pick the cell from step 2 (e.g. $4,500,000). Procurement $800,000 $800,000 10. Repeating the same steps as above, select and link the progress bar infographic and then the data table on the left of this slide. Implementation $200,000 $400,000 Total $1,200,000 $1,300,000 Click Reload Values to update any shape, infographic, chart or data table in your presentation based on the latest values in your source file.
SmartGrid Instructions Watch Video Intermediate 1. Click the SmartGrid button on the Engage tab to show/hide the grid. 2. Uncheck the Aspect Ratio button in the Size section to the right of the SmartGrid button. 3. Select the chart below and click Align to Grid and select 1 (this will align the chart to the first column). 4. With the chart still selected, click the Width columns drop-down under the Aspect Ratio check box and select 12 (this will set the width of the chart to 12 columns wide). 1 2 3 4 5 6 7 8 9 10 11 12 6 4 2 0 Category 1 Category 2 Category 3
SmartColors 63% Android 27% Apple iOS 5% Blackberry 2% Windows Phone 4% Others Instructions Watch Video Beginner 1. Click the Color Swatches drop-down in the Engage tab and select a different color swatch. 2. Select the pie chart above and click on a color from the Engage Shape Fill drop-down in the SmartColors section. 3. You can also create your own color swatch by selecting My Swatches at the bottom of the Color Swatches drop-down.
Flow Instructions Intermediate Watch Video 1. Click Start Presentation under the Flow button Elements Next slide: right arrow key or space bar Previous slide: left arrow key Exit: press Esc to exit Update this Flow presentation 1. Click the Flow button. 2. Click Add Step. 83% 3. Select the Next Steps square on the left, then click Use Selected Shape to confirm. Infographics Next Steps 4. Then click Add Slide and select Slide 12.
Accessibility Instructions Intermediate Watch Video Step 1 1. Select the Step 1 Text Box. 2. Click the Accessibility Check drop down triangle, then select the Color Checker option. Step 2 3. Select a darker background color that passes the color contrast tests. 4. You can also click on the Automatically adjust colors so that they pass button. Step 3 5. Click the Apply Colors button.
Next Steps Take your presentations to the next level with the pro version. Upgrade for only $19/month (billed annually). Upgrade to Pro


