Exploring Opportunities and Challenges in Thriving Cities Survey

Delve into the dynamics of thriving cities through a comprehensive survey covering affordable housing, economic opportunities, environmental equality, and more. Uncover insights on generational economic opportunity, kids in cities, transportation, and the impact on communities. Explore crucial aspects like median household income, environmental justice, and children's well-being in urban environments. Discover the road conditions and mobility issues affecting Michigan and Detroit. Engage with the data and images presented to understand the essence of thriving cities.
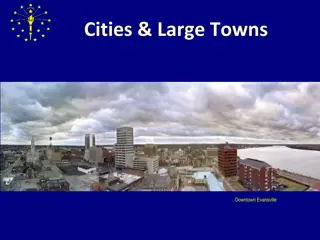
- Thriving Cities Survey
- Affordable Housing
- Economic Opportunities
- Environmental Equality
- Kids in Cities

Download Presentation

Please find below an Image/Link to download the presentation.
The content on the website is provided AS IS for your information and personal use only. It may not be sold, licensed, or shared on other websites without obtaining consent from the author. Download presentation by click this link. If you encounter any issues during the download, it is possible that the publisher has removed the file from their server.
E N D
Presentation Transcript
45% 40% 35% 30% Affordable Housing Economic Opportunity Environmental Equality Kids In Cities Transit & Transportation 25% CITIES SURVEY 20% 15% 10% 5% 0% 1 2 3 4 5
1982 1987 1987 1990s
Affordable & Accessible Housing Generational Economic Opportunity Environmental Equality & Justice Kids in Cities
WHAT IS AFFORDABLE HOUSING? #1 #1 affordable housing af ford able hous ing | \ - f r-d -b l hau -zi \ AFFORDABLE & ACCESSIBLE HOUSING HOUSING AFFORDABLE & ACCESSIBLE 1. Affordable housing means that an individual can secure housing without paying more than 30% of income on housing.
MEDIAN HOUSEHOLD INCOME #2 #2 $52,668 $60,000 GENERATIONAL ECONOMIC OPPORTUNITY OPPORTUNITY GENERATIONAL ECONOMIC $50,000 $27,838 $40,000 $30,000 $20,000 $10,000 $0 Michigan Detroit
POLLUTION #3 ENVIRONMENTAL EQUALITY & ENVIRONMENTAL EQUALITY & JUSTICE JUSTICE
KIDS IN CITIES #4 Michigan 80.64% 8.73% 21.7% 38.5% Detroit 77.27% 10.37% 54.4% 73.7% Graduation Rate Dropout Rate Children in Poverty Free/Reduced Lunch KIDS IN CITIES KIDS IN CITIES
ROAD CONDITION 50% #5 45% 40% MOBILITY, TRANSIT, & TRANSPORTATIO MOBILITY, TRANSIT, & TRANSPORTATION N 35% 30% Michigan Detroit 25% 20% 15% 10% 5% 0% Poor Mediocre Fair Good