Financial Analysis of Marble Mountain Ranch, Inc.
Bryan Elder, a Senior Water Resource Control Engineer at the State Water Resources Control Board, presents a comprehensive financial analysis of Marble Mountain Ranch, Inc. The analysis covers the company's financial health, ability to pay, cash flow, IRS tax filings, and more. Bryan Elder's qualifications and the information reviewed, including tax filings, claim forms, and public records, are detailed. The analysis delves into cash receipts, payments, net worth, assets, liabilities, and financing ability. It highlights the importance of assessing net cash flow, excluding non-cash expenses, and incorporating non-deductible cash expenses for a more accurate financial picture.
Download Presentation

Please find below an Image/Link to download the presentation.
The content on the website is provided AS IS for your information and personal use only. It may not be sold, licensed, or shared on other websites without obtaining consent from the author. Download presentation by click this link. If you encounter any issues during the download, it is possible that the publisher has removed the file from their server.
E N D
Presentation Transcript
Financial Analysis Marble Mountain Ranch, Inc. Bryan Elder, MBA, PE Senior Water Resource Control Engineer Office of Enforcement - Special Investigations Unit State Water Resources Control Board
Qualifications BS Chemical Engineering UC Santa Barbara MS Civil Engineering UC Los Angeles PE Civil Engineer MBA Pepperdine University Graduate coursework in accounting, finance, asset valuation US EPA training on economic benefit and ability to pay financial models Completed >100 economic benefit and >25 ability to pay analyses since 2014 Provide financial training to enforcement staff statewide
Basis of Ability to Pay Net Cash Flow Cash receipts (revenue) Cash payments (expenses) Measure of financial health and company value Net Worth Assets Liabilities Ability to Finance
Information Reviewed Tax filings 2013 2016 MMR-16 Ability to Pay Claim Form (December 12, 2016) MMR-16 Public Records Search (attached to memorandum) Mr. Cole s written testimony MMR-1 KASL Engineering Proposal - MMR-15 Alternative Energy Quotes MMR-19
IRS Tax Filing Summary 2013 $437,330 2014 $474,949 2015 $623,213 2016 $749,250 Gross Income Total Business Expenses/Deductions $384,234 $473,754 $708,217 $886,503 Total Profit/Loss $53,035 $1,195 ($85,004) ($137,253) Taxable income is not representative of financial health or ability to pay.
Cash Flow Analysis Based only on cash expenses incurred Exclude non-cash expenses Depreciation & Amortization 2013 $40,120 2014 $57,823 2015 $186,804 2016 $314,341 Depreciation Expense Total Profit/Loss Cash Flow (pre-principal loan payments) $53,035 $1,195 ($85,004) ($137,253) $93,155 $59,018 $101,800 $177,088
Cash Flow Analysis Add non-deductible cash expenses 2013 $93,155 2014 $59,018 2015 $101,800 2016 $177,088 Cash Flow (pre-principal loan payments) Est. Loan Payments UNKNOWN $49,920 Approx. Net Cash Flow UNKNOWN $127,168
Net Worth Analysis Assets Property Water/Mineral Rights Structures Equipment/Vehicles Livestock Accounts Receivables Cash/Investments
Net Worth Analysis Assets Marble Mountain Ranch properties $913,000 (2017 Assessed Tax Value) Market value unknown Known Assets $212,054 Cash $2,000
Net Worth Analysis Liabilities Mortgages Loans Payable Accounts Payable Liens
Net Worth Analysis Liabilities Mortgages $246,802 (as of 12/2016) Loans Payable $148,000 (as of 12/2016)
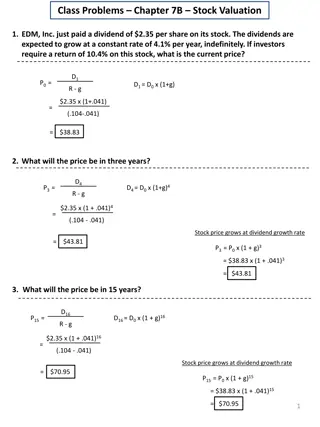
Net Worth Analysis Net Worth = Assets Liabilities Net Worth = $1,127,055 - $394,802 Net Worth = $732,253
Excessive Expenses Analysis 2013 $22,972 (5.2%) $31,296 (7.2%) $18,545 (4.2%) 2014 $69,473 (14.6%) $37,522 (7.9%) $21,935 (4.6%) 2015 $58,464 (9.4%) UNKNOWN 2016 $63,699 (8.5%) $38,347* (5.9%) $75,342 (10.0%) Repairs/Maintenance Utilities Legal/Professional Services UNKNOWN
Alternative Analysis KASL Consulting Engineers Engineering & survey services - $44,250 Design implementation costs unknown Alternative energy $425 526,000 Golden West Energy 6 Year Lease - $55,130 per year + $142,000 buyout Annual increase of ~$21,000 over existing utility expense 7.9% of Gross Revenue (2016)
Summary Net Cash Flow (2016) = $127,168 Net Worth = $732,253 No indication of excessive expenses Alternatives feasible (financially)
