Understanding Cost-Volume-Profit Analysis and Break-Even Analysis

 undefined

COST-VOLUME-PROFIT ANALYSIS AND
BREAK-EVEN ANALYSIS
CHAPTER OBJECTIVES
Meaning of Cost-volume-profit analysis
Objectives of Cost-volume-profit analysis
Assumptions of Cost-volume-profit analysis
Techniques or elements of Cost-volume-profit analysis.
Advantages and limitations of cost-volume-profit analysis.
MEANING OF COST-VOLUME-PROFIT
(CVP) ANALYSIS
Cost-Volume-Profit analysis is a technique for studying the relationship between cost,
volume and profit.
Profits of an undertaking depend upon a large number of factors. But the most important
of these factors are the cost of manufacture, volume of sales and the selling prices of the
products.
In the words of Herman C. Heiser, “the most significant single factor in profit planning of
the average business is the relationship between the volume of business, costs and
profits”. The CVP relationship is an important tool used for the profit planning of a
business.
OBJECTIVES OF COST-VOLUME-PROFIT ANALYSIS
The CVP analysis may be used in determining the break-even-point.
Fixation of selling prices.
Selecting the suitable product/sales mix.
Profit planning and maintaining a desired level of profit.
Determining the optimum level of activity.
Evaluating the performance.
Taking many other decisions involving alternative choices such as make or buy
decision, accept or reject decisions etc.
ASSUMPTIONS OF CVP ANALYSIS
All elements of cost can be segregated into fixed and variable components.
Variable cost remains constant per unit of output irrespective of the level of output and thus
fluctuates directly in proportion to changes in the volume of output.
Fixed costs remain unchanged or constant for the entire volume of production.
Productivity and efficiency of operations remain constant at various levels of operation.
The selling price per unit remains unchanged or constant at all levels of activity.
The volume of production or output is the only factor which influences the costs.
There is no change in the quantity of opening and closing inventories. It is assumed that the
number of units produced equal the number of units sold.
The sales mix remains constant at all levels of activity in case of multi product firms.
Total costs and total revenues are linear functions of output.
TECHNIQUES OR ELEMENTS OF
COST-VOLUME-PROFIT ANALYSIS
CONTRIBUTION MARGIN CONCEPT
Contribution is the difference between sales and variable cost or marginal cost of sales. It may also be
defined as the excess of selling price over variable cost per unit. Contribution is also known as
Contribution Margin or Gross Margin. Contribution being the excess of sales over variable cost is the
amount that is contributed towards fixed expenses and profit.
Contribution can be represented as :
Contribution = Sales – Variable (Marginal) Cost
or Contribution (per unit) = Selling Price–Variable (or marginal) cost per unit
or Contribution = Fixed Costs + Profit (—Loss)
ADVANTAGES OF CONTRIBUTION
Marginal Cost Equation
For the sake of convenience, a marginal cost equation can be derived as follows :
Sales – Variable cost = Contribution
or,
Sales = Variable cost + Contribution
or,
Sales = Variable cost + Fixed Cost ± Profit/Loss
or,
Sales–Variable cost = Fixed cost ± Profit/Loss
or,
S – V = F ± P
where
‘S’ stands for Sales
‘V’ stands for Variable cost
‘F’ stands for Fixed cost
‘P’ stands for Profit/Loss
The marginal cost equation is very useful in the sense that if any three factors out of the four are known, the fourth can
easily be found out.
PROFIT/VOLUME RATIO (P/V RATIO
OR C/S RATIO)
BREAK-EVEN ANALYSIS
The study of cost-volume profit analysis is often referred to as ‘break-even analysis’ and the two
terms are used interchangeably by many. This is so, because break-even analysis is the most
widely known form of cost-volume-profit analysis. The term “break-even analysis” is used in
two senses—narrow sense and broad sense. In its broad sense, break-even analysis refers to the
study of relationship between costs, volume and profit at different levels of sales or production.
In its narrow sense, it refers to a technique of determining that level of operations where total
revenues equal total expenses,
i.e.,
the point of no profit, no loss.
ASSUMPTIONS OF BREAK-EVEN ANALYSIS
All elements of cost,
i.e.,
production, administration and selling and distribution can be segregated
into fixed and variable components.
Variable cost remains constant per unit of output irrespective of the level of output and thus
fluctuates directly in proportion to changes in the volume of output.
Fixed cost remains constant at all volumes of output.
Selling price per unit remains unchanged or constant at all levels of output.
Volume of production is the only factor that influences cost.
There will be no change in the general price-level.
There is only one product or in case of multi-products, the sales mix remains unchanged.
There is synchronisation between production and sales.
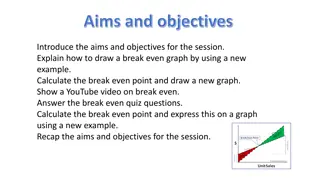
BREAK EVEN POINT
The break-even point may be defined as that point of sales volume at which total revenue is equal to total cost.
It is a point of no profit, no loss. A business is said to break-even when its total sales are equal to its total
costs. The break-even point refers to that level of output which evenly breaks the costs and revenues and
hence the name. At this point, contribution,
i.e.,
sales minus marginal cost, equals the fixed costs and hence
this point is often called as
‘
Critical Point’
or
‘
Equilibrium Point’
or
‘
Balancing Poin
t’
or no profit, no loss.
If production/sales is increased beyond this level, there shall be profit to the organisation and if it is decrease
from this level, there shall be loss to the organisation.
Break-even point can be stated in the form of an equation :
Sales revenue at break-even point = Fixed Costs + Variable Costs.
COMPUTATION OF THE BREAK-EVEN POINT
The break-even point can be computed by the following methods :
The Algebraic Formula Method
Graphic or Chart Method.
Algebraic formula method for computing the break-even point
The break-even point can be computed in terms of :
Units of sales volume.
Budget total or in terms of money value.
As a percentage of estimated capacity.
(a)
Break-Even Point in Units
As the break-even point is the point of no profit no loss, it is that level of output at which the total
contribution equals the total fixed costs, It can be calculated with the help of following formula :
CASH BREAK-EVEN POINT
In the present competitive world of business, it may be difficult for new industrial units to achieve the break-
even point in the initial years. Thus, the concept of cash break-even point has emerged. The cash break-even
point may be defined as that point of sales volume at which total revenue is equal to total cash cost. At this
point, cash contribution (which is calculated after making adjustment for variable portion of depreciation, etc.)
equals the cash fixed cost, i.e., fixed cost excluding depreciation and deferred expenses. This point enables the
management to determine the level of activity below which the liquidity position of the firm would be
adversely affected.
Thus, cash break-even point may be calculated as:
COMPOSITE BREAK-EVEN POINT
(MULTIPRODUCT SITUATION)
So far we have dealt with break-even point of firms producing single product. We can also
calculate the composite break-even point for a firm producing several products, as below :
OPERATING LEVERAGE AND RISK
Operating leverage results from the presence of fixed costs that help in magnifying net operating income
fluctuations flowing from small variations in revenue. The fixed cost is treated as fulcrum of a leverage.
The changes in sales are related to changes in revenue. The fixed costs do not change with the change in
sales. Any increase in sales, fixed costs remaining the same, will magnify the operating revenue. The
operating leverage occurs when a firm has fixed costs which must be recovered irrespective of sales
volume. The fixed costs remaining same, the percentage change in operating revenue will be more than
the percentage change is sales. The occurrence is known as
operating leverage.
The degree of operating
leverage depends upon the amount of fixed elements in the cost structure. Operating leverage can be
determined by means of a break even or cost volume profit analysis.
The degree of leverage will be calculated as :
ASSUMPTIONS UNDERLYING BREAK-
EVEN CHARTS
All costs can be separated into fixed and variable costs.
Fixed costs remain constant at all levels of activity.
Variable cost fluctuates directly in proportion to changes in the volume of output.
Selling prices per unit remain constant at all levels of activity.
There is no opening or closing stock.
There will be no change in operating efficiency.
Product mix remains unchanged or there is only one product.
The volume of output or production is the only factor which influences the cost.
ADVANTAGES OR USES OF BREAK-EVEN CHARTS
Information provided by the break-even chart is in a simple form and is clearly understandable even to a
layman. The whole idea of the problem is presented at a glance.
The break-even chart is very useful to the management for taking managerial decisions because the chart
studies the relationship of cost, volume and profit at various levels of output. The effects of changes in fixed
costs and variables costs at various levels of output and that of changes in the selling price on the profits can
be depicted very clearly by way of break-even charts.
The break-even charts help in knowing and analysing the profitability of different products under various
circumstances.
A break-even chart is very useful for forecasting (the costs and profits), planning and growth.
The break-even chart is a managerial tool for control of costs as it shows the relative importance of fixed cost
in the total cost of a product.
Besides determining the break-even point, profits at various levels of output can also be determined with the
help of break-even charts.
The break-even charts can also be used to study the comparative plant efficiencies of business.
LIMITATIONS OF BREAK-EVEN CHARTS
MARGIN OF SAFETY
The excess of actual or budgeted sales over the break-even sales is known as the margin of safety. It is the
difference between actual sales minus the sales at break-even point.Margin of Safety = Total Sales – Sales at Break-
Even Point.
PROFIT-VOLUME GRAPH
Profit-volume graph is a pictorial representation of the profit-volume relationship. This graph shows profit and loss at
different volumes of sales. It is said to be a simplified form of break-even chart as it clearly represents the relationship of
profit to volume of sales.
The construction of a profit-volume graph involves the following steps :
Sales line (in volume or value) is drawn on horizontal or x-axis.
Profits and losses are given on vertical or y-axis.
The area above the horizontal of x-axis is called the profit area and the area below the horizontal axis is the loss
area.
Profits and losses at different levels of activity are plotted against corresponding sales and then these points are
joined and extended. This line is called profit line. In case of more than one products, a separate profit line for
each product should be drawn.
The point where profit line intersects with the sales line is the break-even point.
ADVANTAGES OF MARGINAL COSTING
AND CVP ANALYSIS
LIMITATIONS/DISADVANTAGES OF
MARGINAL COSTING & CVP ANALYSIS
The technique of marginal costing is
based upon a number of assumptions
which may not hold
good under all circumstances.
All costs are not divisible into fixed and variable.
There are certain costs which are semi-variable in
nature. it is very difficult and arbitrary to classify these costs into fixed and variable elements.
Variable costs do not always remain constant
and do not always vary in direct proportion to
volume of output because of the laws of diminishing and increasing returns.
Selling prices do not remain constant
for ever and for all levels of output due to competition,
discounts for bulk orders, changes in the general price level, etc.
Fixed costs do not remain constant
after a certain level of activity. Further, marginal costing ignores
the fact that fixed costs are also controllable.
The exclusion of fixed costs from the stocks of finished goods and work-in-progress is illogical since
fixed costs are also incurred on the manufacture of products.
Stocks valued on marginal costing are
undervalued
and the profit and loss account cannot reveal true profits. Similarly, as the stock are
undervalued, the balance sheet does not give a true picture.
Although the technique of marginal costing overcomes the problem of under or over-absorption of
fixed overheads, the problem still exists in regard to
under or over-absorption of variable overheads.
Marginal costing completely
ignores the ‘time factor’.
Thus, if two jobs give equal contribution but one takes
longer time to complete, the one which takes longer time should be regarded as costlier than the other. But
this fact is ignored altogether under marginal costing.
The technique of marginal costing
cannot be applied
in contract or ship-building industry because in such
cases, normally the value of work-in-progress is very high and the exlusion of fixed overheads may result into
losses every year and huge profit in the year of completion of the job.
Cost control
can be better be achieved with the help of
other techniques,
viz., standard costing and budgetary
control than by marginal costing technique.
Fixation of selling prices
in the long run cannot be done without considering fixed costs. Thus, pricing
decisions cannot be based on marginal cost alone.
In CVP analysis, it is assumed that
productivity and efficiency
will remain constant at various levels of
operation. This assumption may not hold good in real situations.
It is difficult to establish cost-volume-profit relationship when there is a change in the quantum of
opening
and closing inventories.
It is difficult to use the cost-volume-profit analysis for a
multi-product firm
or situation.
In the present days of automation, the proportion of fixed costs in relation to variable costs is very high and
hence
managerial decisions based upon only the marginal cost ignoring equally important element of fixed
cost may not be correct.
Although, the technique of marginal costing suffers from the above mentioned limitations, it is a very
useful tool in the hands of the management and is extensively used for cost control, decision-making and
profit
Cost-Volume-Profit (CVP) analysis is a valuable technique that examines the connection between costs, volume, and profits in business operations. By determining the break-even point, setting selling prices, optimizing product mix, and enhancing profit planning, CVP analysis aids in making informed decisions. This analysis relies on specific assumptions such as fixed and variable costs, constant selling prices, and consistent production levels. The contribution margin concept plays a crucial role in analyzing the profitability of products or services.
- Cost-Volume-Profit Analysis
- Break-Even Analysis
- Profit Planning
- Business Decisions
- Contribution Margin

Download Presentation

Please find below an Image/Link to download the presentation.
The content on the website is provided AS IS for your information and personal use only. It may not be sold, licensed, or shared on other websites without obtaining consent from the author. Download presentation by click this link. If you encounter any issues during the download, it is possible that the publisher has removed the file from their server.
E N D
Presentation Transcript
COST-VOLUME-PROFIT ANALYSIS AND BREAK-EVEN ANALYSIS
CHAPTER OBJECTIVES Meaning of Cost-volume-profit analysis Objectives of Cost-volume-profit analysis Assumptions of Cost-volume-profit analysis Techniques or elements of Cost-volume-profit analysis. Advantages and limitations of cost-volume-profit analysis.
MEANING OF COST-VOLUME-PROFIT (CVP) ANALYSIS Cost-Volume-Profit analysis is a technique for studying the relationship between cost, volume and profit. Profits of an undertaking depend upon a large number of factors. But the most important of these factors are the cost of manufacture, volume of sales and the selling prices of the products. In the words of Herman C. Heiser, the most significant single factor in profit planning of the average business is the relationship between the volume of business, costs and profits . The CVP relationship is an important tool used for the profit planning of a business.
OBJECTIVES OF COST-VOLUME-PROFIT ANALYSIS The CVP analysis may be used in determining the break-even-point. Fixation of selling prices. Selecting the suitable product/sales mix. Profit planning and maintaining a desired level of profit. Determining the optimum level of activity. Evaluating the performance. Taking many other decisions involving alternative choices such as make or buy decision, accept or reject decisions etc.
ASSUMPTIONS OF CVP ANALYSIS All elements of cost can be segregated into fixed and variable components. Variable cost remains constant per unit of output irrespective of the level of output and thus fluctuates directly in proportion to changes in the volume of output. Fixed costs remain unchanged or constant for the entire volume of production. Productivity and efficiency of operations remain constant at various levels of operation. The selling price per unit remains unchanged or constant at all levels of activity. The volume of production or output is the only factor which influences the costs. There is no change in the quantity of opening and closing inventories. It is assumed that the number of units produced equal the number of units sold. The sales mix remains constant at all levels of activity in case of multi product firms. Total costs and total revenues are linear functions of output.
TECHNIQUES OR ELEMENTS OF COST-VOLUME-PROFIT ANALYSIS
CONTRIBUTION MARGIN CONCEPT Contribution is the difference between sales and variable cost or marginal cost of sales. It may also be defined as the excess of selling price over variable cost per unit. Contribution is also known as Contribution Margin or Gross Margin. Contribution being the excess of sales over variable cost is the amount that is contributed towards fixed expenses and profit. Contribution can be represented as : Contribution = Sales Variable (Marginal) Cost or Contribution (per unit) = Selling Price Variable (or marginal) cost per unit or Contribution = Fixed Costs + Profit ( Loss)
ADVANTAGES OF CONTRIBUTION It helps the management in the fixation of selling prices. It assists in determining the break-even point. It helps management in the selection of a suitable product mix for profit maximisation. It helps in choosing from among alternative methods of production ; the method which gives highest contribution per limiting factor is adopted. It helps the management in deciding whether to purchase or manufacture a product or a component. It helps in taking a decision as regards to adding a new product in the market.
Marginal Cost Equation For the sake of convenience, a marginal cost equation can be derived as follows : Sales Variable cost = Contribution or, Sales = Variable cost + Contribution or, Sales = Variable cost + Fixed Cost Profit/Loss or, Sales Variable cost = Fixed cost Profit/Loss or, S V = F P where S stands for Sales V stands for Variable cost F stands for Fixed cost P stands for Profit/Loss The marginal cost equation is very useful in the sense that if any three factors out of the four are known, the fourth can easily be found out.
PROFIT/VOLUME RATIO (P/V RATIO OR C/S RATIO) on profit of changes in the volume.
BREAK-EVEN ANALYSIS The study of cost-volume profit analysis is often referred to as break-even analysis and the two terms are used interchangeably by many. This is so, because break-even analysis is the most widely known form of cost-volume-profit analysis. The term break-even analysis is used in two senses narrow sense and broad sense. In its broad sense, break-even analysis refers to the study of relationship between costs, volume and profit at different levels of sales or production. In its narrow sense, it refers to a technique of determining that level of operations where total revenues equal total expenses, i.e.,the point of no profit, no loss.
ASSUMPTIONS OF BREAK-EVEN ANALYSIS All elements of cost, i.e., production, administration and selling and distribution can be segregated into fixed and variable components. Variable cost remains constant per unit of output irrespective of the level of output and thus fluctuates directly in proportion to changes in the volume of output. Fixed cost remains constant at all volumes of output. Selling price per unit remains unchanged or constant at all levels of output. Volume of production is the only factor that influences cost. There will be no change in the general price-level. There is only one product or in case of multi-products, the sales mix remains unchanged. There is synchronisation between production and sales.
BREAK EVEN POINT The break-even point may be defined as that point of sales volume at which total revenue is equal to total cost. It is a point of no profit, no loss. A business is said to break-even when its total sales are equal to its total costs. The break-even point refers to that level of output which evenly breaks the costs and revenues and hence the name. At this point, contribution, i.e., sales minus marginal cost, equals the fixed costs and hence this point is often called as Critical Point or Equilibrium Point or Balancing Point or no profit, no loss. If production/sales is increased beyond this level, there shall be profit to the organisation and if it is decrease from this level, there shall be loss to the organisation. Break-even point can be stated in the form of an equation : Sales revenue at break-even point = Fixed Costs + Variable Costs.
COMPUTATION OF THE BREAK-EVEN POINT The break-even point can be computed by the following methods : The Algebraic Formula Method Graphic or Chart Method. ALGEBRAIC FORMULA METHOD FOR COMPUTING THE BREAK-EVEN POINT The break-even point can be computed in terms of : Units of sales volume. Budget total or in terms of money value. As a percentage of estimated capacity.
(a) Break-Even Point in Units As the break-even point is the point of no profit no loss, it is that level of output at which the total contribution equals the total fixed costs, It can be calculated with the help of following formula : (b) Break-even Point in terms of budget-total or money value At break-even point : Total Sales = Total Fixed Cost + Total Variable Cost or S = F + V (where S = Sales, F = Fixed Cost and V = Variable cost) or S V = F S S V V (Dividing both sides by S V) F =S V V F or =S or 1 F S =S or S 1 (Multiplying both sides by S) V Fixed Cost Sales Variable Cost Fixed Cost Contribution Contribution Sales Hence, break even sales = Sales = Sales Fixed Cost P/ V ratio With the use of P/V Ratio, B.E.P. = As, = P/ V ratio
(c) Break-even Point as a percentage of estimated capacity Break-even point can also be computed as a percentage of the estimated sales or capacity by dividing the break-even sales by the capacity sales. For example, if a firm has an estimated capacity of 1,00,000 units of products and its break-even point is reached at 50,000 units, then the break-even point is at 50% of capacity (1,00,000/50,000). If information as to total contribution at full capacity is available, the break-even point as a percentage of estimated capacity can be found as
CASH BREAK-EVEN POINT In the present competitive world of business, it may be difficult for new industrial units to achieve the break- even point in the initial years. Thus, the concept of cash break-even point has emerged. The cash break-even point may be defined as that point of sales volume at which total revenue is equal to total cash cost. At this point, cash contribution (which is calculated after making adjustment for variable portion of depreciation, etc.) equals the cash fixed cost, i.e., fixed cost excluding depreciation and deferred expenses. This point enables the management to determine the level of activity below which the liquidity position of the firm would be adversely affected. Thus, cash break-even point may be calculated as:
COMPOSITE BREAK-EVEN POINT (MULTIPRODUCT SITUATION) So far we have dealt with break-even point of firms producing single product. We can also calculate the composite break-even point for a firm producing several products, as below :
OPERATING LEVERAGE AND RISK Operating leverage results from the presence of fixed costs that help in magnifying net operating income fluctuations flowing from small variations in revenue. The fixed cost is treated as fulcrum of a leverage. The changes in sales are related to changes in revenue. The fixed costs do not change with the change in sales. Any increase in sales, fixed costs remaining the same, will magnify the operating revenue. The operating leverage occurs when a firm has fixed costs which must be recovered irrespective of sales volume. The fixed costs remaining same, the percentage change in operating revenue will be more than the percentage change is sales. The occurrence is known as operating leverage. The degree of operating leverage depends upon the amount of fixed elements in the cost structure. Operating leverage can be determined by means of a break even or cost volume profit analysis. The degree of leverage will be calculated as :
Contribution = Sales Variable cost Operating Profit = Sales Variable Cost Fixed cost or O.P. The break even point can be calculated by dividing the fixed cost by percentage of contribution to sales or P/V Ratio. Fixed Cost Break Even Point = P/V Ratio Contribution P/V Ratio = Sales When production and sales move above the break even point, the firm enters highly profitable range of activities. At break even point the fixed costs are fully recovered, any increase in sales beyond this level will increase profits equal to contribution. A firm operating with a high degree of leverage and above break even point earns good amount of profits. If a firm does not have fixed costs then there will be no operating leverage. The percentage change in sales will be equal to the percentage change in profit. When fixed costs are there, the percentage change in profits will be more than the percentage in sales volume. Thus, degree of operating leverage can be computed as below : = Contribution Fixed Cost
ASSUMPTIONS UNDERLYING BREAK- EVEN CHARTS All costs can be separated into fixed and variable costs. Fixed costs remain constant at all levels of activity. Variable cost fluctuates directly in proportion to changes in the volume of output. Selling prices per unit remain constant at all levels of activity. There is no opening or closing stock. There will be no change in operating efficiency. Product mix remains unchanged or there is only one product. The volume of output or production is the only factor which influences the cost.
ADVANTAGES OR USES OF BREAK-EVEN CHARTS Information provided by the break-even chart is in a simple form and is clearly understandable even to a layman. The whole idea of the problem is presented at a glance. The break-even chart is very useful to the management for taking managerial decisions because the chart studies the relationship of cost, volume and profit at various levels of output. The effects of changes in fixed costs and variables costs at various levels of output and that of changes in the selling price on the profits can be depicted very clearly by way of break-even charts. The break-even charts help in knowing and analysing the profitability of different products under various circumstances. A break-even chart is very useful for forecasting (the costs and profits), planning and growth. The break-even chart is a managerial tool for control of costs as it shows the relative importance of fixed cost in the total cost of a product. Besides determining the break-even point, profits at various levels of output can also be determined with the help of break-even charts. The break even charts can also be used to study the comparative plant efficiencies of business.
LIMITATIONS OF BREAK-EVEN CHARTS A break-even chart is based upon a number of assumptions, which may not hold good under all circumstances. A break-even chart provides only a limited information. Break-even charts present only cost-volume profit relationships but ignore other important considerations such as the amount of capital investment, marketing problems and government policies, etc. A break-even chart does not suggest any action or remedies to the management as a tool of management decisions. More often, a break-even chart presents only a static view of the problem under consideration.
MARGIN OF SAFETY The excess of actual or budgeted sales over the break-even sales is known as the margin of safety. It is the difference between actual sales minus the sales at break-even point.Margin of Safety = Total Sales Sales at Break- Even Point. Margin of safety calculated in percentage is also known as Margin of Safety Ratio and can be expressed as : M.S. Ratio = M.S. 100 Sales Actual Sales Sales at B.E.P. Sales = 100 Margin of safety can also be calculated with the help of the following formula : Profit Margin of Safety (M/S) =P/ V Ratio
PROFIT-VOLUME GRAPH Profit-volume graph is a pictorial representation of the profit-volume relationship. This graph shows profit and loss at different volumes of sales. It is said to be a simplified form of break-even chart as it clearly represents the relationship of profit to volume of sales. The construction of a profit-volume graph involves the following steps : Sales line (in volume or value) is drawn on horizontal or x-axis. Profits and losses are given on vertical or y-axis. The area above the horizontal of x-axis is called the profit area and the area below the horizontal axis is the loss area. Profits and losses at different levels of activity are plotted against corresponding sales and then these points are joined and extended. This line is called profit line. In case of more than one products, a separate profit line for each product should be drawn. The point where profit line intersects with the sales line is the break-even point.
ADVANTAGES OF MARGINAL COSTING AND CVP ANALYSIS 1. Simple to operate and easy to understand 2. 3. Helps management in Production Planning. 4. No possibility of fictitious profits by over-valuing stocks 5. Facilitates calculation of important factors like B.E.P. 6. Valuable aid to management for Decision-Making Removes complexities of under-absorption of overheads 7. 8. 9. Facilitates study of relative profitability Complimentary to Standard Costing and Budgetary control Helps in Cost Control Profit Planning Management Reporting 10. 11.
LIMITATIONS/DISADVANTAGES OF MARGINAL COSTING & CVP ANALYSIS The technique of marginal costing is based upon a number of assumptions which may not hold good under all circumstances. All costs are not divisible into fixed and variable. There are certain costs which are semi-variable in nature. it is very difficult and arbitrary to classify these costs into fixed and variable elements. Variable costs do not always remain constant and do not always vary in direct proportion to volume of output because of the laws of diminishing and increasing returns. Selling prices do not remain constant for ever and for all levels of output due to competition, discounts for bulk orders, changes in the general price level, etc. Fixed costs do not remain constant after a certain level of activity. Further, marginal costing ignores the fact that fixed costs are also controllable. The exclusion of fixed costs from the stocks of finished goods and work-in-progress is illogical since fixed costs are also incurred on the manufacture of products. Stocks valued on marginal costing are undervalued and the profit and loss account cannot reveal true profits. Similarly, as the stock are undervalued, the balance sheet does not give a true picture. Although the technique of marginal costing overcomes the problem of under or over-absorption of fixed overheads, the problem still exists in regard to under or over-absorption of variable overheads.
Marginal costing completely ignores the time factor. Thus, if two jobs give equal contribution but one takes longer time to complete, the one which takes longer time should be regarded as costlier than the other. But this fact is ignored altogether under marginal costing. The technique of marginal costing cannot be applied in contract or ship-building industry because in such cases, normally the value of work-in-progress is very high and the exlusion of fixed overheads may result into losses every year and huge profit in the year of completion of the job. Cost control can be better be achieved with the help of other techniques, viz., standard costing and budgetary control than by marginal costing technique. Fixation of selling prices in the long run cannot be done without considering fixed costs. Thus, pricing decisions cannot be based on marginal cost alone. In CVP analysis, it is assumed that productivity and efficiency will remain constant at various levels of operation. This assumption may not hold good in real situations. It is difficult to establish cost-volume-profit relationship when there is a change in the quantum of opening and closing inventories. It is difficult to use the cost-volume-profit analysis for a multi-product firm or situation. In the present days of automation, the proportion of fixed costs in relation to variable costs is very high and hence managerial decisions based upon only the marginal cost ignoring equally important element of fixed cost may not be correct. useful tool in the hands of the management and is extensively used for cost control, decision-making and profit Although, the technique of marginal costing suffers from the above mentioned limitations, it is a very


 Break-Even Point in Units")
 Break-even Point as a percentage of estimated capacity")