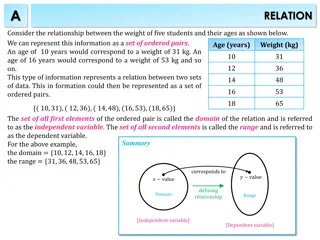
Analysis of Bordeaux En Primeur Wine Ratings with Copula Functions
Exploring the influence of wine critic ratings, particularly Robert Parker Jr., on Bordeaux en primeur wine pricing using copula functions. This study delves into the impact of barrel ratings on en primeur prices, showcasing the significance of critics in the wine market. The Bordeaux en primeur process, its benefits to purchasers and producers, and the uncertainty surrounding pricing are discussed in depth.

Download Presentation

Please find below an Image/Link to download the presentation.
The content on the website is provided AS IS for your information and personal use only. It may not be sold, licensed, or shared on other websites without obtaining consent from the author. Download presentation by click this link. If you encounter any issues during the download, it is possible that the publisher has removed the file from their server.
E N D
Presentation Transcript
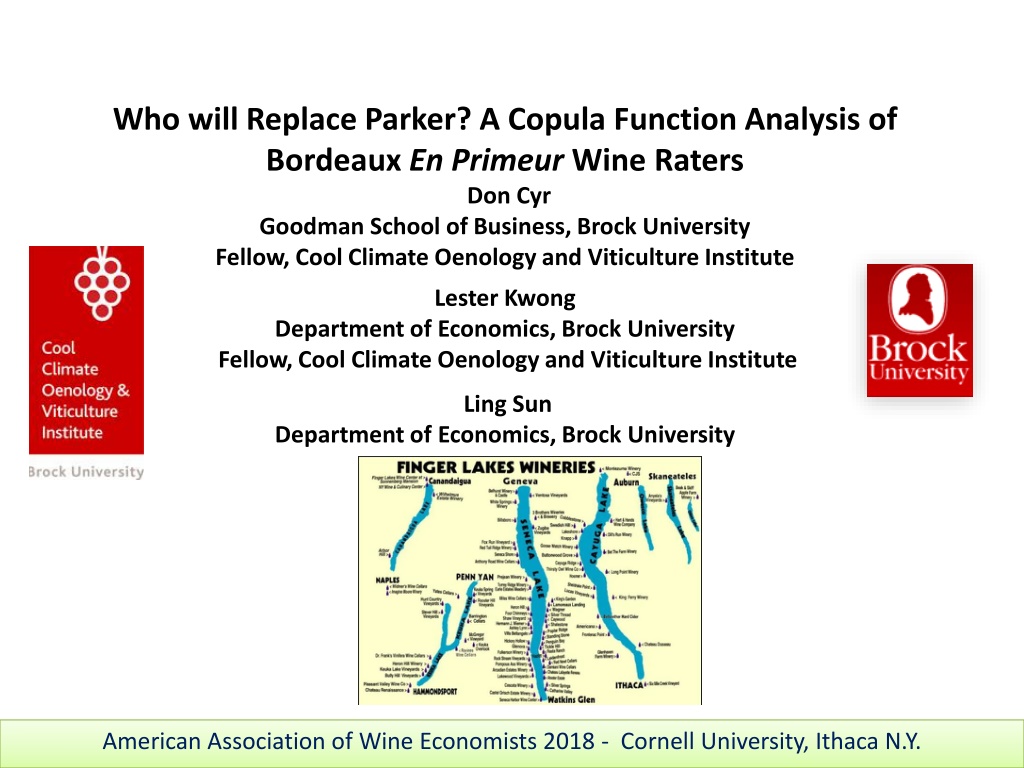
Who will Replace Parker? A Copula Function Analysis of Bordeaux En Primeur Wine Raters Don Cyr Goodman School of Business, Brock University Fellow, Cool Climate Oenology and Viticulture Institute Brock University Lester Kwong Department of Economics, Brock University Fellow, Cool Climate Oenology and Viticulture Institute Ling Sun Department of Economics, Brock University American Association of Wine Economists 2018 - Cornell University, Ithaca N.Y.
Introduction Bordeaux en primeux process Impact of wine critic ratings and wine prices Robert Parker and Neal Martin Copula functions and their use in modelling nonlinear dependence Data Results and Conclusion American Association of Wine Economists 2018 - Cornell University, Ithaca N.Y.
En Primeur Process The Bordeaux En Primeur Process Existed in France for centuries as a form of futures market Spring of each year, after the prior harvest, merchants, wine critics and trade associations gather to taste and rank barrel samples of wines that are frequently eight to ten months old Wine is then sold ahead of bottling and ultimate release of the vintage, which may be up to two years later Benefit to Purchaser - provides the opportunity for the purchaser to secure a vintage before it is bottled and released, typically at a much lower price Benefit to Producer - cash flow prior to the release and sale of the wine in the retail market Uncertainty - the chateau must decide how much wine to allocate to futures sales as opposed to the retail market, when the wine is bottled and released Risk is mitigated the higher the en primeur price prices shown to be heavily dependent on the critic barrel scores achieved American Association of Wine Economists 2018 - Cornell University, Ithaca N.Y.
Wine Critic Barrel Ratings Impact of Parker Barrel Ratings En primeur prices appear to be heavily dependent upon the ranking of the wine based on the barrel tastings, despite the uncertainty remaining, associated with the continued aging process It has long been known in the Bordeaux en primeur market that that the barrel scores of the prestigious wine critic Robert Parker Jr. have had a great influence on the en primeur price offering by the chateaux Parker s ratings were largely viewed as the authority on Bordeaux en primeur wines Cyr et al. (2017), Noparumpa et al. (2015), Ali et al. (2010), Ashenfelter, (2010), Jones and Storchmann, (2001). American Association of Wine Economists 2018 - Cornell University, Ithaca N.Y.
Wine Critic Barrel Ratings Impact of Wine Critics Ratings on Wine Prices A fairly large body of literature deals with the impact of the ratings of wine critics on the demand for wine and wine prices. Studies of this nature have been carried out for wines originating from several countries and over different time periods Over 60 studies and 180 hedonic wine price models over a 20 year period..... The research identifies that the relation between the price of wine and its sensory quality rating is a moderate partial correlation of +0.30. Oczkowski, E., & Doucouliagos, H. (2015). Wine prices and quality ratings: A meta- regression analysis. American Journal of Agricultural Economics, 97(1), 103-121. American Association of Wine Economists 2018 - Cornell University, Ithaca N.Y.
Wine Critic Barrel Ratings Impact of Wine Critics Ratings on Wine Prices Cyr, D., Kwong, L., & Sun, L. (2017). An examination of tail dependence in Bordeaux futures prices and Parker ratings. Journal of Wine Economics, 12(3), 252- 266. Explores the nonlinearities of the bivariate distribution of Bordeaux en primeur, or wine futures, prices and Parker barrel ratings for the period of 2004 through 2010. In particular, copula-function methodology is introduced and employed to examine the nature of the bivariate distribution. Our results show a significant nonlinear relationship between Parker ratings and wine prices, characterized by significant positive tail dependence and higher correlation between high ratings and high prices. American Association of Wine Economists 2018 - Cornell University, Ithaca N.Y.
Wine Critic Barrel Ratings Comparison of Wine Critics Ratings Ashton, R. H. (2012). Reliability and Consensus of Experienced Wine Judges: Expertise Within and Between? Journal of Wine Economics, 7(01), 70-87.. - Mean reliability between judges is .5 across various studies. Cardebat, J. M., & Livat, F. (2016). Wine experts rating: a matter of taste?. International Journal of Wine Business Research, 28(1), 43-58. Variation might be explained by taste preferences of critics Cardebat, J. M., & Paroissien, E. (2015). Standardizing expert wine scores: An application for Bordeaux en primeur. Journal of Wine Economics, 10(03), 329- 348. - non parametric methodology to express the scores of each wine expert on the same rating scale American Association of Wine Economists 2018 - Cornell University, Ithaca N.Y.
Wine Critic Barrel Ratings February 2015 After 38 years, Parker announced that he would no longer review Bordeaux wine futures; turning the responsibility over to his successor Neal Martin, a British wine critic. Martin a wine blogger who started the website Wine Journal in 2003 gained a substantial following over a short period of time and joined Parker s prestigious publication, the Wine Advocate as a wine writer and critic in 2006. April 2016 - Martin assumed responsibility for the review of all Bordeaux wines, both in barrel and bottle, for the Wine Advocate American Association of Wine Economists 2018 - Cornell University, Ithaca N.Y.
Wine Critic Barrel Ratings Issue Parker is credited with having had a significant impact on Bordeaux wines Pushed the industry to invest in new technology and equipment resulting in greater consistency over the years Not without some controversy Parker has been criticised for advocating style over substance, resulting in a homogenous world of highly oaked and over- extracted wines. However, had a significant impact in expanding Bordeaux in terms of the American/New World market. Appointment of Martin creates some uncertainty for many chateaux, both with respect to the future influence of Martin s ratings and their consistency, or lack thereof, with that of Parker s. Question is that given the investment in designing wines around the preferences of Parker, who would be closest to Parker of several known or regular wine critic s? American Association of Wine Economists 2018 - Cornell University, Ithaca N.Y.
Wine Critic Barrel Ratings AAWE 2017 we presented results using copula functions of a study of the bivariate distributional relationship of en primeur wines independently rated by both Parker and Martin for the period of 2010 through 2012. Provides for 325 left bank concurrent wine ratings and 332 in the case of the right bank, over the three year period. It has been noted that both critics have expressed a preference for Merlot dominated blends stemming from Bordeaux right bank wines American Association of Wine Economists 2018 - Cornell University, Ithaca N.Y.
RESULTS Significant tail dependence in the multivariate distribution of Parker s and Martin s ratings, particularly for left bank wines. 2011, 2012: Martin s ratings of left bank wines appear to be highly correlated with that of Parker s when the ranking is high (upper tail dependence), but less so at the lower range. The right bank exhibits a different correlation pattern. 2010 upper tail dependence 2011 and 2012 - Gaussian (Normal) copula - lack of tail dependence along with slightly less correlation Did Martin start to develop his own idiosyncratic preferences in terms of Bordeaux wines and particularly highly ranked right bank wines? If so, does this add risk for right bank Bordeaux wine producers, in terms of uncertainty with respect to Martin s preferences and in particular their consistency with Parker s preferences? American Association of Wine Economists 2018 - Cornell University, Ithaca N.Y.
Data and Analysis Database of en primeur prices along with wine critics ratings are available from Bolomey Wijnimport Amsterdam wine sellers www.bordoverview.com Data is also provided for left bank ( Cabernet Sauvignon dominant) and right bank (Merlot dominant) wines Jones and Storchman (2001) - Show less sensitivity of wine prices to Parker ratings in the case of wines with a higher share of Merlot grape than Cabernet Sauvignon. Screenshot of database American Association of Wine Economists 2018 - Cornell University, Ithaca N.Y.
Data and Analysis Wine Critics that Overlap with Parker (Other than Martin) *Decanter (De): English wine magazine. 1 to 5 stars, from 2007 to 2014 a 10 - 20 scale, since 2015 the 100 points scale. Before 2015 the wines were tasted by Steven Spurrier, James Lawther MW and Beverley Blanning MW *Michel Bettane & Thierry Desseauve (B&D): French wine critics publishing in TAST. Scale from 10 to 20. *Perswijn (PW): Dutch wine magazine, tasted by Ronald de Groot. 1 to 5 stars. **Ren Gabriel (RG): Swiss wine critic publishing in WeinWisser. 10 to 20 scale. No ratings post 2015 *James Suckling (JS): American wine critic James Suckling published in the American magazine Wine Spectator up to and including the Bordeaux 2009 vintage. From Bordeaux 2010 vintage he publishes on his website JamesSuckling.com. Scale of 75 to 100. *Jane Anson (JA): English wine journalist writing for Decanter Magazine and publishing on her website New Bordeaux. Scale of 75 to 100. Sometimes adds a plus (+) to her rating. Became rate for Decanter after 2015. *La Revue du Vin de France (RVF): French wine magazine. Scale from 10 to 20. The wines are tasted by Olivier Poels, H l ne Durand and Philippe Maurange. **Le Point (LeP): French magazine. The leading taster is Jacques Dupont. Scale from 10 to 20. *Jeff Leve (JL): American wine critic publishing on his website TheWineCellarInsider.com. scale from 75 to 100. *Appears to continue to rate en primeur. ** Does not appear to continue to rate. American Association of Wine Economists 2018 - Cornell University, Ithaca N.Y.
Data and Analysis Others New Lisa Perrotti-Brown, Wine Advocate (WA): American wine critic publishing on erobertparker.com, starting with the Bordeaux 2017 vintage. She rates the wines on a scale from 75 to 100. Chris Kissack (CK): English wine critic, publishing on thewinedoctor.com He rates the wines on a scale from 75 to 100. Started in 2017? American Association of Wine Economists 2018 - Cornell University, Ithaca N.Y.
Data and Analysis Number of wines jointly rated with Parker Right Bank Data *PW Year 2005 2006 2007 2008 2009 2010 2011 2012 *DE 114 96 86 114 147 122 130 127 936 *B&D 107 94 98 134 151 **RG *JS 132 90 83 17 155 115 *JA *RVF 73 79 94 76 87 81 77 46 613 **LeP 98 *JL 97 103 116 125 126 146 155 140 140 68 108 43 74 58 351 124 99 118 657 49 641 2005-2012 584 832 98 Left Bank Data *PW Year 2005 2006 2007 2008 2009 2010 2011 2012 *DE 138 110 97 120 138 123 108 119 953 *B&D **RG *JS 139 99 79 29 138 108 *JA *RVF 87 83 86 84 88 84 85 73 670 **LeP 113 *JL 98 93 113 115 102 103 624 88 100 32 624 2005-2012 113 188 American Association of Wine Economists 2018 - Cornell University, Ithaca N.Y.
Copula Function Approach Model Risk Risk due to assumptions regarding the fundamental dependence structure between variables and its stationarity. Generally a regression analysis is used, assuming the dependence structure is captured fairly well by linear correlation. It appears that this is not often the case. One solution to the issue is the use of copula functions to fit multivariate distributions, incorporating nonlinear dependence Useful for capturing tail dependence : higher correlation at the tails of the marginal distributions comprising the multivariate distribution. Cyr, D., Kwong, L., & Sun, L. (2017). An examination of tail dependence in Bordeaux futures prices and Parker ratings. Journal of Wine Economics, 12(3), 252-266. American Association of Wine Economists 2018 - Cornell University, Ithaca N.Y.
COPULA Functions Based upon Sklar s Theorem (1959) If F is a joint distribution function of m random variables (y1,...,ym) with marginal distributions F1,......,Fm Then there exists an m-dimensional copula C:[0,1]m [0,1] (from the unit m-cube to the unit interval) which satisfies the following conditions: 1. C (1,...,1,an, 1,...,1) = an for every n m and for all an in [0,1] If the realizations of m-1 variables are known, each with a probability of one, then the joint probability of the m outcomes is the same as the probability of the remaining uncertain outcomes. 2. C(a1,...,am) = 0 if an = 0 for any n m The joint probability of all outcomes is zero if the marginal probability of any outcome is zero. 3. C is m-increasing C-volume of any m-dimensional interval is non-negative. American Association of Wine Economists 2018 - Cornell University, Ithaca N.Y.
COPULA Functions Sklar s Theorem (1959) Given F (y1,...,ym) with univariate marginal distributions F1(y1),...,Fm(ym) and inverse functions F1-1,..., Fm-1, then y1 = F1-1(u1)~F1,..., ym = Fm-1(um)~Fm Where u1,...,um are uniformly distributed variates. F(y1,...,ym) = F(F1-1(u1),..., Fm-1(um)) = Pr[U1 u1,..., Um um] = C(u1,...,um) Is the unique copula function associated with the distribution function and (F1(y1),...,Fm(ym)) ~ C and if U ~ C, then (F1-1(u1),..., Fm-1(um)) ~ F Essentially Copulas can be used to express a multivariate distribution in terms of its marginal distributions! American Association of Wine Economists 2018 - Cornell University, Ithaca N.Y.
COPULA Functions Sklar s Theorem (1959) For an m-variate function F, the copula associated with F is a distribution function C:[0,1]m [0,1] that satisfies. F (y1,...,ym) = C (F1(y1),...,Fm(ym); ) Where is a vector of parameters called the dependence parameter which measures dependence between the marginals. In bivariate applications is typically a scalar. The joint distribution is expressed in terms of its respective marginal distributions and a function C that binds them together. This allows for the consideration of marginal distributions and dependence as two separate but related issues. American Association of Wine Economists 2018 - Cornell University, Ithaca N.Y.
COPULA Functions Application of Copula Functions For a variety of reasons, largely due to the high dimensionality of m 3 copula estimation, most research has focused on bivariate parametric copulas. Parametric copulas -Implicit (Gaussian and Student t copula) implied by known multivariate distribution functions and do not have simple closed forms. -Explicit (Archimedian Copulas) simple closed forms. Form and relationship of parameters to Spearman correlation American Association of Wine Economists 2018 - Cornell University, Ithaca N.Y.
COPULA Functions Two Parametric Families of Copula Functions are commonly used. 1. ELLIPTICAL COPULAS Can capture some degree of tail dependence but are limited in that they are symmetric. Tend to under estimate tail dependence if it is asymmetric. Gaussian (Normal) Copula Student-T Copula More flexible than the Gaussian copula because It does not assume that uncorrelated variables are independent. American Association of Wine Economists 2018 - Cornell University, Ithaca N.Y.
COPULA Functions ARCHIMEDIAN COPULAS allow for a wider variety of dependence structures, particularly asymmetric Clayton Copula Greater dependence in the lower tail. Gumbel Copula Greater dependence in the upper tail. Frank Copula Greater correlation in the middle section than in the tails. American Association of Wine Economists 2018 - Cornell University, Ithaca N.Y.
COPULA Functions Clayton and Gumbel Copulas can also be estimated as transformations of the variables (u, v) by taking one or both of the variables and transforming them as 1-u and/or 1-v, resulting in three additional patterns that can be tested. This provides for directional patterns of 1, 2, 3 and 4. American Association of Wine Economists 2018 - Cornell University, Ithaca N.Y.
COPULA Functions Aside: Interesting connection between copula function modelling and the 2008 Financial Crisis - the incorrect use of the Gaussian copula to model CDO s comprised of multiple mortgages to imply diversification and low risk (Should instead have been taking into account tail dependence). Salmon, F. (2009). Recipe for Disaster: The Formula That Killed Wall Street, Wired Magazine http://archive.wired.com/techbiz/it/magazine/17-03/wp_quant?currentPage=all Warning! Same Issue: Based on incorrect copula function modelling, the issue is building again in financial markets in terms of Collateralized Loan Obligations (based on high risk commercial loans): Collateralized loan obligations: Our next Financial Nightmare, Fortune, April, 2014 Wall Street's Risky and Complex Loan Deals Are a Hit in Asia, Bloomberg News, May 18, 2017. CLO Market Cheers End of Risk-Retention Rules,, Reuters. Feb 13, 2018 Wall Street firms are cheering a court ruling that will exempt Collateralized Loan Obligation (CLO) funds from complying with Dodd-Frank Act rules that require investment managers to hold some of their deals risk. American Association of Wine Economists 2018 - Cornell University, Ithaca N.Y.
COPULA Functions Tail Dependence Parameters With the Archimedean family (Clayton and Gumbel copulas in particular) asymmetric tail dependence structures can be measured in a tractable way. In particular upper ( U [0,1]) and lower ( L [0,1]) asymptotic tail dependence measures can frequently be derived from the copula parameters as well as, in limited cases, the relationship to rank correlation measures such as Kendall s tau ( K) and Spearman s rho ( S). American Association of Wine Economists 2018 - Cornell University, Ithaca N.Y.
Data and Analysis Standard Approach to Copula Function Modelling: Fit several copula functions to the data and apply maximum likelihood goodness- of-fit tests to see which function models the dependency structure relatively better. Information Criteria Tests (varying penalties for additional parameters) Akaike Information Criteria (AIC) Bayesian (Schwartz) Information Criteria (BIC) Hannan-Quinn Information Criteria (HQIC) Problem is that they do not provide the power of the decision rule. American Association of Wine Economists 2018 - Cornell University, Ithaca N.Y.
Goodness of Fit Tests for Copulas A few goodness of fit tests have recently been developed for copula functions but significant issues still remain: Problematic due to the high dimensionality of the problem. Full multivariate approach - Panchenco (2005) Physica A Consequently there are approaches that attempt to reduce the problem from a multivariate to a univariate problem: Berg and Batten (2005) Norwegian Computing Centre Genest, Quessy and Remillard (2006) Scandinavian Journal of Statistics However the power of the tests appear to differ with sample size, dimensionality and copula function being tested: Berg, D. (2009). Copula goodness-of-fit testing: an overview and power comparison. The European Journal of Finance, 15(7-8), 675-701 Fermanian, J. D. (2013). An overview of the goodness-of-fit test problem for copulas. In Copulae in Mathematical and Quantitative Finance (pp. 61-89). Springer Berlin Heidelberg. American Association of Wine Economists 2018 - Cornell University, Ithaca N.Y.
Data and Analysis : Copula function models were estimated in terms of the relationship between Parker s ratings and those of other wine critics for each of the years of jointly ranked data and for left and right bank in each case, using Vose ModelRisk software. www.vosesoftware.com Maximum likelihood estimation of copula function parameters used to identify best fit among traditional copula functions Clayton Frank Gumbel Normal T American Association of Wine Economists 2018 - Cornell University, Ithaca N.Y.
RESULTS (RIGHT BANK) Right Bank (Robert Parker and Decanter) Copula Parameter Clayton 0.74 Clayton 0.81 Gumbel 1.77 Gumbel 1.98 Normal 0.76 Gumbel 1.92 Gumbel 1.67 Normal 0.59 Gumbel 1.83 Clayton 0.73 Year 2005 2006 2007 2008 2009 2010 2011 2012 2010-12 2005-2012 U 0.39 0.43 0.52 0.58 0.00 0.56 0.49 0.00 0.54 0.39 obs 114 96 86 114 147 122 130 127 379 936 Direction 4 4 1 1 Correlation 0.49 0.49 0.57 0.68 0.75 0.69 0.59 0.57 0.65 0.60 1 1 1 4 Right Bank (Robert Parker and Neil Martin) Copula Parameter Clayton 1.79 Normal 0.49 Normal 0.67 Year 2010 2011 2012 U 0.68 0.00 0.00 obs 107 117 108 Direction 4 Correlation 0.67 0.47 0.65 2010-2012 332 Gumbel 1.76 1 0.62 0.52 Clayton Direction 4 indicates inverted transformed data upper tail dependence American Association of Wine Economists 2018 - Cornell University, Ithaca N.Y.
RESULTS (RIGHT BANK) Right Bank (Robert Parker and Michel Bettane & Thierry Desseauve (B&D)) Year 2005 2006 2007 2008 2009 U 0.61 0.00 0.00 0.47 0.64 obs 107 94 98 134 151 Copula Clayton Normal Normal Gumbel Clayton Parameter 1.40 0.61 0.36 1.63 1.53 Direction 4 Correlation 0.62 0.59 0.35 0.55 0.64 1 4 2005-2009 584 Clayton 1.29 4 0.58 0.58 Clayton Direction 4 indicates inverted transformed data upper tail dependence American Association of Wine Economists 2018 - Cornell University, Ithaca N.Y.
RESULTS (RIGHT BANK) Perswijn (PW): Dutch wine magazine, tasted by Ronald de Groot. 1 to 5 stars. Right Bank (Robert Parker and Perswijn) Copula Parameter Clayton 1.06 Clayton 0.80 Clayton 0.89 Clayton 1.27 Clayton 0.86 Clayton 0.96 Clayton 1.00 Clayton 0.89 Year 2006 2007 2008 2010 2011 2012 2010-12 2006-2012 U 0.52 0.42 0.46 0.58 0.44 0.49 0.50 0.46 obs 97 103 116 124 99 118 341 657 Direction 4 4 4 4 4 4 4 4 Correlation 0.49 0.47 0.49 0.62 0.48 0.50 0.53 0.49 Clayton Direction 4 indicates inverted transformed data upper tail dependence American Association of Wine Economists 2018 - Cornell University, Ithaca N.Y.
RESULTS (RIGHT BANK) James Suckling (JS): published in the American magazine Wine Spectator and later on his website JamesSuckling.com. Scale of 75 to 100. Right Bank (Robert Parker and JS) Year obs Copula Parameter 2005 132 Normal 2006 90 Clayton 2007 83 Normal 2008 17 Normal 2009 155 Gumbel 2010 115 Clayton 2012 49 Clayton 2010,12 164 Clayton 2005-2012 641 Gumbel U 0.00 0.53 0.00 0.00 0.54 0.69 0.48 0.65 0.54 Direction Correlation 0.58 0.54 0.42 0.69 0.68 0.68 0.54 0.64 0.66 0.60 1.10 0.44 0.70 1.84 1.84 0.95 1.63 1.85 4 1 4 4 4 1 Clayton Direction 4 indicates inverted transformed data upper tail dependence American Association of Wine Economists 2018 - Cornell University, Ithaca N.Y.
RESULTS (RIGHT BANK) Jane Anson (JA): English wine journalist writing for Decanter Magazine and publishing on her website New Bordeaux. Scale of 75 to 100. Became rater for Decanter after 2015. Right Bank (Robert Parker and JA) Copula Parameter Clayton Clayton Clayton Clayton Normal Clayton Clayton Year 2008 2009 2010 2011 2012 2010-12 2008-2012 U 0.17 0.48 0.45 0.27 0.00 0.16 0.32 obs 68 108 43 74 58 175 351 Direction 4 4 4 4 Correlation 0.24 0.52 0.53 0.32 0.17 0.26 0.39 0.39 0.94 0.86 0.53 0.18 0.38 0.62 4 4 Clayton Direction 4 indicates inverted transformed data upper tail dependence American Association of Wine Economists 2018 - Cornell University, Ithaca N.Y.
RESULTS (RIGHT BANK) La Revue du Vin de France (RVF): French wine magazine. Scale from 10 to 20. The wines are tasted by Olivier Poels, H l ne Durand and Philippe Maurange. Right Bank (Robert Parker and RVF) Year obs Copula Parameter 2005 73 T 2006 79 Clayton 2007 94 Normal 2008 76 Clayton 2009 87 Gumbel 2010 81 Clayton 2011 77 Clayton 2012 46 Normal 2010-12 204 Gumbel 2005-2012 613 Clayton U 4.00 0.64 0.00 0.69 0.52 0.59 0.48 0.00 0.49 0.26 Direction Correlation 0.52 0.58 0.46 0.57 0.63 0.60 0.52 0.53 0.61 0.55 0.54 1.54 0.48 1.85 1.78 1.31 0.96 0.54 1.68 0.51 4 4 1 4 4 1 4 Clayton Direction 4 indicates inverted transformed data upper tail dependence American Association of Wine Economists 2018 - Cornell University, Ithaca N.Y.
RESULTS (RIGHT BANK) 2010-12 Comparision U 0.54 0.50 0.65 0.16 0.49 0.52 Rater Obs 379 341 164 175 204 332 Copula Gumbel Clayton Clayton Clayton Gumbel Gumbel Corr 0.65 0.53 0.64 0.26 0.61 0.62 Both Decanter and James Suckling have higher correlation and higher upper tail dependence with Parker than Neal Martin. De PW JS JA RVF NM 2008-09 Comparision Decanter and James Suckling have both higher correlation and higher upper tail dependence with Parker than others. U 0.58 0.46 0.55 0.44 0.58 Rater Obs 261 116 172 176 163 Copula Gumbel Clayton Gumbel Clayton Clayton Corr 0.72 0.49 0.70 0.49 0.54 De PW JS JA RVF American Association of Wine Economists 2018 - Cornell University, Ithaca N.Y.
Conclusion Decanter s en primeur ratings are now completed by Jane Anson ( since 2015). It would appear that James Suckling is the active en primeur wine critic whose ratings are most consistent with that of Parker s, particularly in terms of highly rated wines. More so than Neal Martin. American Association of Wine Economists 2018 - Cornell University, Ithaca N.Y.
Continued Debate About the Influence of Parker "Parker lost 10 years in Bordeaux!"Jacques Dupont The stopping of the "notes" of the American taster strongly influenced the taste and the structure of the wines of 2016 ... Is this the end of Bordeaux bashing? http://www.lepoint.fr/dossiers/vins/journal-des-primeurs-2016/journal-des-primeurs- 9-parker-a-fait-perdre-10-ans-a-bordeaux-03-04-2017-2116931_3393.php Question as to whether Parker s preferences and the opening of Bordeaux to the New World market is still relevant: Esposito, A. Wine Preferences Changing in the US, April 19th, 2018, Euromontor International https://blog.euromonitor.com/2018/04/wine-preferences-changing- us.html?aliId=166353768 Consumers are also gravitating towards more complex wines as their knowledge and willingness to try new offerings increase. American Association of Wine Economists 2018 - Cornell University, Ithaca N.Y.
Continued Debate About the Influence of Parker Thatch, L. and Chang, K. Adventure, Tradition, and Semi-Sweet Wines Highlighted in 2016 American Wine Consumer Survey, Winebusiness.com December 06, 2016 The top five favorite varietals for the 2016 sample were the same as in previous years with chardonnay, cabernet sauvignon, merlot, pinot noir and pinot grigio as the most preferred. semi-sweet replaced fruity as the most preferred style in 2016. American Association of Wine Economists 2018 - Cornell University, Ithaca N.Y.
Other Areas of Research with Copula Functions Increased use of Copula functions in Agricultural Economics for the modelling of the relationship between weather variables, prices and crop yields Vedenov (2008) ) - Application of copulas to estimation of joint crop yield distributions Woodward et al. (2011) - Impact of copula choice on the modeling of crop yield basis risk Bokusheva (2011) - Measuring dependence in joint distributions of yield and weather variables Okhrin et al., (2013) - Systemic weather risk and crop insurance: the case of China Boziac et al. (2014) - Tails Curtailed: accounting for nonlinear dependence in pricing margin insurance for dairy farmers Bokusheva et al (2016). Satellite-based vegetation health indices as a criteria for insuring against drought-related yield losses Cyr, D., Eyler, R., & Visser, M. (2013). The Use of Copula Functions in Pricing Weather Contracts for the California Wine Industry. Working paper. Brock University American Association of Wine Economists 2018 - Cornell University, Ithaca N.Y.
The End American Association of Wine Economists 2018 - Cornell University, Ithaca N.Y.


")
")
")
")
")
")
")