Understanding Data Analysis: A Visual Guide
A comprehensive guide to organizing data sets, calculating averages, identifying modes, and determining medians. Explore examples and solutions for a deeper understanding of data analysis concepts such as sorting, mode identification, and median calculation.

Download Presentation

Please find below an Image/Link to download the presentation.
The content on the website is provided AS IS for your information and personal use only. It may not be sold, licensed, or shared on other websites without obtaining consent from the author. Download presentation by click this link. If you encounter any issues during the download, it is possible that the publisher has removed the file from their server.
E N D
Presentation Transcript
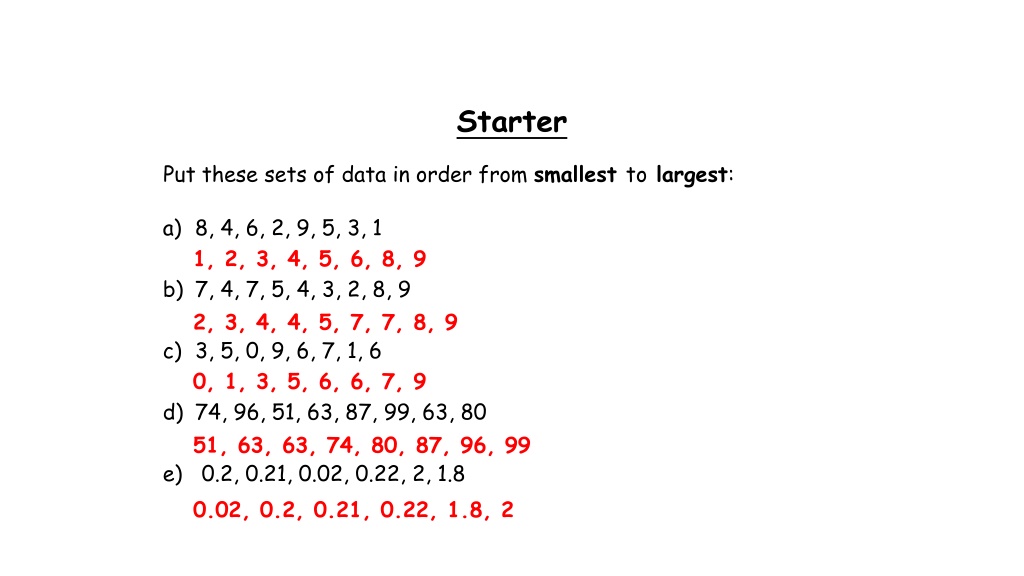
Starter Put these sets of data in order from smallest to largest: a) 8, 4, 6, 2, 9, 5, 3, 1 1, 2, 3, 4, 5, 6, 8, 9 b) 7, 4, 7, 5, 4, 3, 2, 8, 9 2, 3, 4, 4, 5, 7, 7, 8, 9 c) 3, 5, 0, 9, 6, 7, 1, 6 0, 1, 3, 5, 6, 6, 7, 9 d) 74, 96, 51, 63, 87, 99, 63, 80 51, 63, 63, 74, 80, 87, 96, 99 e) 0.2, 0.21, 0.02, 0.22, 2, 1.8 0.02, 0.2, 0.21, 0.22, 1.8, 2
Averages An average summarises groups of data. Median, mode and mean are types of average. The range is how far from the smallest to the largest piece of data.
Mode Mode is the most common number 1. Put the numbers in order 2. Choose the number that appears the most frequently. 3. Sometimes there may be more than one mode. Example: Class shoe sizes: 3, 5, 5, 6, 4, 3, 2, 5, 6 Put in order: 2, 3, 3, 4, 5, 5, 5, 6, 6 The mode is 5
Mode The number of matches in 14 boxes were counted and recorded below. Find the mode of the data. 48, 49, 50, 51, 49, 49, 55, 47, 50, 50, 50 47, 48, 49, 49, 49, 50, 50, 50, 50, 51, 55 Mode = 50
Mode 2, 4, 4, 6, 7, 8 16, 15, 19, 17, 16, 14 11, 13, 12, 14, 15, 13, 16 4, 7, 9, 9, 9, 10, 11, 13 45, 54, 34, 45, 36, 40 57, 56, 52, 51, 52, 54 3, 5, 2, 4, 5, 6, 5 99, 92, 100, 92, 97, 98 87, 82, 88, 89, 88, 82 23, 24, 21, 23, 25 5, 6, 8, 9, 5, 8, 8, 7 23, 24, 28, 29, 31, 22 Extension: Write a set of numbers with a mode of 18.
Answers 4 16 13 9 45 52 5 92 82 & 88 23 8 None
Median The median is the middle value 1. Put the numbers in order 2. Cross off the numbers from both ends of the list 3. The median is the one in the middle 4. If there are 2 numbers in the middle then it is halfway between them. Example: Class shoe sizes: 3, 5, 5, 6, 4, 3, 2, 5, 6 Put in order: 2, 3, 3, 4, 5, 5, 5, 6, 6 The class median shoe size is 5
Median Robert hit 11 balls at Grimsby driving range. The recorded distances of his drives, measured in yards, are given below. Find the median distance for his drives. 85, 125, 130, 65, 100, 70, 75, 50, 140, 95, 70 50, 65, 70, 70, 75, 85, 95, 100, 125, 130, 140 Median drive = 85 yards
Median 2, 4, 4, 6, 7, 8, 5 16, 15, 19, 17, 16, 14, 15 11, 13, 12, 14, 15, 13, 16 4, 7, 9, 9, 9, 10, 11, 13, 15 45, 54, 34, 45, 36, 40, 39 57, 56, 52, 51, 52, 54 3, 5, 2, 4, 5, 6, 5 99, 92, 100, 98, 97, 98 87, 82, 88, 89, 88, 82 23, 24, 21, 23, 25 5, 6, 8, 9, 5, 8, 8, 7 23, 24, 28, 29, 31, 22 Extension: Write a set of numbers with a median of 12.
Answers 6 16 13 9 40 53 5 98 87.5 23 7.5 26
Mean Mean is mean to work out! 1. Add all the numbers together 2. Divide that answer by the amount of numbers you had to begin with Example: Class shoe sizes: 3, 5, 5, 6, 4, 3, 2, 1, 5, 6 Add together: 3 + 5 + 5 + 6 + 4 + 3 + 2 + 1 + 5 + 6 = 40 Divide by the amount we started with: 40 10 = 4 So the mean is 4.
Mean Two dice were thrown 10 times and their scores were added together and recorded. Find the mean for this set of data. 7, 5, 2, 7, 6, 12, 10, 4, 8, 9 Mean = 7 + 5 + 2 + 7 + 6 + 12 + 10 + 4 + 8 + 9 10 = 70 = 7 10
Mean 2, 4, 4, 6, 7, 8, 4 16, 15, 19, 17, 16, 14, 15 11, 13, 12, 14, 15, 13, 13 4, 7, 9, 9, 9, 10, 11, 5 39, 54, 34, 45, 36, 40, 39 57, 56, 52, 51, 52, 56 3, 5, 2, 4, 5, 6, 3 99, 92, 100, 98, 97, 108 87, 82, 88, 89, 88, 82 23, 24, 21, 23, 19 5, 6, 8, 9, 5, 8, 8, 7 23, 24, 28, 29, 31, 24 Extension: Write a set of numbers with a mean of 8.
Answers 5 16 13 8 41 54 4 99 86 22 7 26.5
Range Range is how far from biggest to smallest. 1. Put the numbers in order 2. Take the smallest number away from the largest. Example: Class shoe sizes: 3, 5, 5, 6, 4, 3, 2, 5, 6 Put in order: 2, 3, 3, 4, 5, 5, 5, 6, 6 Smallest number is 2, largest number is 6 6 2 = 4 So the range = 4
Range Twenty students sat a maths test. Their marks out of 10 are recorded below. Find the range of test results. 2, 5, 9, 3, 7, 8, 6, 3, 4, 3, 2, 7, 9, 5, 8, 7, 2, 5 2, 2, 2, 3, 3, 3, 4, 5, 5, 5, 6, 7, 7, 7, 8, 8, 9, 9 Largest number Smallest number 9 2 = 7 So the range is 7
Range 2, 4, 4, 6, 7, 8, 4 16, 15, 19, 17, 16, 14, 15 11, 13, 12, 14, 15, 13, 16 4, 7, 9, 9, 9, 10, 11, 5 45, 54, 34, 45, 36, 40, 39 57, 56, 52, 51, 52, 54 3, 5, 2, 4, 5, 6, 3 99, 92, 100, 98, 97, 98 87, 82, 88, 89, 88, 82 23, 24, 21, 23, 19 5, 6, 8, 9, 5, 8, 8, 7 23, 24, 28, 29, 31, 22 Extension: Write a set of numbers with a range of 22.
Answers 6 5 5 7 20 6 4 8 7 5 4 9
How confident do you feel with this topic? Write red, amber or green in your book! Complete the corresponding activity
Plenary Use the information given to work out the set of data: 3 3 5 9 10 ___ ___ ___ ___ ___ Mode = 3 Median = 5 Range = 7 Mean = 6
Starter The following shows the heights of some students in Miss Roberts class. 132 cm 102 cm 145 cm 127 cm 119 cm 132 cm 102 cm 125 cm Calculate the mode, median, mean and range of the data above. Extension: What does this information tell us?
132 cm 102 cm 145 cm 127 cm 119 cm 132 cm 102 cm 123 cm Mode = 102 cm Median = 125 cm Mean = 122.75 cm Range = 43 cm
132 cm 102 cm 145 cm 127 cm 119 cm 132 cm 102 cm 123 cm Mode = 102 cm Median = 125 cm The mode tells us the most common height in the class Mean = 122.75 cm Range = 43 cm
132 cm 102 cm 145 cm 127 cm 119 cm 132 cm 102 cm 123 cm Mode = 102 cm Median = 125 cm The median tells us the middle height in the class if the students were put in height order Mean = 122.75 cm Range = 43 cm
132 cm 102 cm 145 cm 127 cm 119 cm 132 cm 102 cm 123 cm Mode = 102 cm The mean tells us the mathematical average of all the heights in the class Median = 125 cm Mean = 122.75 cm Range = 43 cm
132 cm 102 cm 145 cm 127 cm 119 cm 132 cm 102 cm 123 cm Mode = 102 cm Median = 125 cm The range tells us the spread of all the heights in the class Mean = 122.75 cm Range = 43 cm The range is NOT an average
132 cm 102 cm 145 cm 127 cm 119 cm 132 cm 102 cm 123 cm Mode = 102 cm Median = 125 cm Mean = 122.75 cm Range = 43 cm Which of the averages is most useful?
Copy and complete the table below. Advantage Most common piece of data Disadvantage May be skewed Mode Middle piece of data Ignores extremes Median Mathematical average May be skewed by extremes Mean Range Shows variation/spread/ consistency Not an average
When comparing data, we use the mean and the range. The median tells us the middle average of the data. The range tells us how consistent the data is. We must make sure that our answer is in the context of the question.
Mr Fredericksons class has a median height of 120 cm and a range of 52 cm. Compare the heights of the students in these two classes. On average, Miss Roberts class is taller. There is also less variation in the heights of the children in Miss Roberts class. Miss Roberts class: Median = 125 cm Range = 43 cm
John wants to know if compost improves the growth of plants. So he put compost in the ground floor garden plants and did not put it in the garden on the terrace. Based on the data is there any reason to believe compost improves the growth of plants? Ground floor garden plant height (cm): 15, 10, 19, 17, 16, 12, 20, 22, 18, 35, 25, 14, 28, 29, 30 Terrace garden plant height (cm): 6, 7, 10, 12, 18, 17, 14, 8, 9, 23, 20, 21, 19, 27, 26
Ground floor garden plant height (cm): 15, 10, 19, 17, 16, 12, 20, 22, 18, 35, 25, 14, 28, 29, 30 Terrace garden plant height (cm): 6, 7, 10, 12, 18, 17, 14, 8, 9, 23, 20, 21, 19, 27, 26 Ground floor Terrace Median Range 19 cm 17 cm 17 cm 25 cm
John wants to know if compost improves the growth of plants. So he put compost in the ground floor garden plants and did not put it in the garden on the terrace. Based on the data is there any reason to believe compost improves the growth of plants? Ground floor Terrace Median Range 19 cm 17 cm 17 cm 25 cm On average, the plants without the compost are taller. However the plants that had the compost were of a more consistent height. The data does not suggest that compost improves the growth of plants if John wants them to grow tall.
We can use the interquartile range to interpret the consistency of a set of data more accurately. interquartile range Between Quarter Spread We can use the interquartile range to interpret the consistency of a set of data more accurately.
Ground floor garden plant height (cm): 10, 12, 14, 15, 16, 17, 18, 19, 20, 22, 25, 28, 29, 30, 35 Terrace garden plant height (cm): 6, 7, 8, 9, 10, 12, 14, 17, 18, 19, 20, 21, 23, 26, 27 Ground floor Terrace Median Range UQ LQ IQR 19 cm 17 cm 17 cm 25 cm 21 cm 28 cm 9 cm 15 cm 12 cm 13 cm We can see the plants that had the compost were of a more consistent height (smaller interquartile range).
Reminder This is a box plot: Minimum Maximum Median Lower quartile Upper quartile
Colin took a sample of 80 football players. He recorded the total distance, in kilometres, each player ran in the first half of their matches on Saturday. Colin drew this box plot for his results. a) Work out the interquartile range. UQ = 5.6 km LQ = 4.85 km IQR = 5.6 4.85 = 0.75 km
Colin took a sample of 80 football players. He recorded the total distance, in kilometres, each player ran in the first half of their matches on Saturday. Colin drew this box plot for his results. There were 80 players in Colin's sample. b) Work out the number of players who ran a distance of more than 5.6 km. UQ = 5.6 km Quartile = of 80 = 20 players
Colin took a sample of 80 football players. He recorded the total distance, in kilometres, each player ran in the first half of their matches on Saturday. Colin drew this box plot for his results. On average, the players ran further in the first half. Colin also recorded the total distance each player ran in the second half of their matches. He drew the box plot below for this information. The players were equally consistent in distances run in both halves of the match. c) Compare the distribution of the distances run in the first half with the distribution of the distances run in the second half.
Answers 1. First tray taller on average. Equally consistent. 2. b) Men are older on average. More variation of women s ages. 3. b) Boys are taller on average. Less variation in heights of boys. 4. a) c) 12 Travel times consistently less on Monday on average.
Starter Ed has 4 cards. There is a number on each card. 12 6 ? 15 The mean of the 4 numbers on Ed's cards is 10 Work out the number on the 4th card. 12 + 6 + 15 + ? = 10 4 12 + 6 + 15 + ? = 40 ? = 7
There are 15 children at a birthday party. The mean age of the 15 children is 7 years. 9 of the 15 children are boys. The mean age of the boys is 5 years. Work out the mean age of the girls. Total of all ages = 15 x 7 = 105 Total = 105 5 5 5 5 5 5 5 5 5 Boys Girls Total = 45 Total = 60 60 6 = 10
Tina went on a cycling holiday. For the first 5 days, Tina cycled a mean distance of 55 kilometres per day. On the sixth day, Tina cycled 50 kilometres. Andy says, "for all 6 days, the mean distance that Tina cycled per day was 52.5 kilometres". Is Andy correct? You must show your working. Total = 325 55 55 55 55 55 50 First 5 days 325 6 = 54.17 km (2 d.p.) Andy is not correct.
50 students each did a mathematics test. The mean score for these 50 students was 8.4 There were 30 boys. The mean score for these 30 boys was 8.25 Work out the mean score for the girls. Total = 420 Total = ____ Total = 247.5 Total = 172.5 Boys Girls 172.5 20 = 8.625 This makes sense as the boys average score was below the overall average so the girls average score will be above the overall average
Answers 1. 216 people 2. 158.1 cm 3. 30 minutes 4. 20 sweets 5. 75.5 6. 13 points 7. 68 8. Greater than 75% because there s a greater proportion of boys and boys did better than girls on average (76%)


:")


:")