Understanding Ethics and Data Governance in Data Science
Evolution of data ecosystem, importance of data ethics for data scientists, and understanding data governance framework are crucial aspects covered in this content. Examples of data breaches highlight the need for ethical data collection practices, while implementing a data governance framework ensures proper management of data assets for organizational success.

Download Presentation

Please find below an Image/Link to download the presentation.
The content on the website is provided AS IS for your information and personal use only. It may not be sold, licensed, or shared on other websites without obtaining consent from the author. Download presentation by click this link. If you encounter any issues during the download, it is possible that the publisher has removed the file from their server.
E N D
Presentation Transcript
Grade XI Data Science Version 1.0
Chapter 1: Ethics in Data Science By the end of this chapter, students should be able to understand: Evolution of data Need for data scientists to understand data ethics Understanding data governance framework
Evolution of Data Ecosystem Finally, data evolved to become massive, integrated and dynamic. Later data evolved to become large, unstructured and in motion. Initially data was small, structural and static.
Need for Data Scientists to understand data ethics A few people can do an immense amount of harm. Some of the examples of data breach that has occurred in the past are: Yahoo data breach in the year 2013 compromised around 3 billion user data. Marriott (Starwood) hotel data breach compromised 383 million user accounts.
Need for Data Scientists to understand data ethics Sometimes data is collected without taking consent from the user. In the past, a leading social networking site performed an experiment without taking consent from the user. In this experiment, users were purposely fed data newsfeed with highly extreme point of view, thereby trying to elicit reactions out of them.
Understanding Data Governance Framework Data governance framework can be defined as a collection of practices and processes that ensure the authorized management of data in an organization. The primary purpose behind implementing data governance by any organization is to achieve better control over its data assets, including the methods, technologies, and behaviors around the proper management of data.
Understanding Data Governance Framework Some of the benefits of implementing a data governance framework are: Procedures around regulation and compliance activities become streamlined. There is greater transparency within data-related activities. Increase in value of organization s data. Better resolution of issues around current data.
Chapter 2:Assessing data By the end of this chapter, students should be able to understand: Difference between story and fact Trial assessment in detail
Story An account of experiences of events presented by a person. What is a Story? A story can be biased either in favor of or against an idea or thing.
Facts Fact is a truth that has either happened or continues to happen in this universe. What is a fact? People inspect a fact or a series of facts to derive a conclusion.
What is a trial assessment ? A trial assessment is a set of steps executed to support, reject or confirm an assumption. Trial Assessment An example of trial assessment would be to study the effects of different duration of light on the growth of radish seedlings.
To get a better understanding about trial assessment, we first need to understand the following concept: Correlation, which describes the direction of relationship between two or more variables. Here, we cannot assume that change in one variable gives rise to the change in the other variables. E.g., Increase in sales of winter care products in USA is correlated to the increase in sales of summer care products in Australia. Trial Assessment Causation, which shows that the occurrence of one event originates the occurrence of the other events. E.g., Declaration of festive discounts causes increase in the number of purchased products.
Following are the characteristics of a trial assessment: Trial assessment (experiment) consists of two sets of variables; namely the treatment variable and the response variable. The treatment variable is an independent variable. The response variable is a dependent variable. Trial Assessment In a trial assessment, a supervised study is performed to understand the cause-and-effect relationship. Based on the results, researcher concludes if treatment had a causal effect on the response variable.
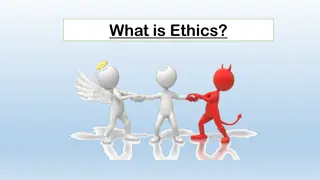
Trial Assessment Understanding cause & effect via trial assessment
Perception of time It is intended to highlight a person s subjective experience of duration of time within an ongoing event. The perceived duration can vary significantly between different individuals and/or different circumstances. E.g., When experiencing a stressful event by a human for the first time, the time spent while experiencing the event appears to be longer than the actual time interval.
Chapter 3: Forecasting on data By the end of this chapter, students should be able to understand: Forecasting Observational study Need for observational study Pros and cons of observational study
What is a forecasting ? Forecasting Use the present and the historical data to predict the future.
What is an observational study ? In an observational study: Observational study Subjects are observed and results are noted. No interference with the subject to affect the outcome.
Why Observational study when there is trial assessment ? Trial assessment in some scenarios leads to unethical practices. Observational study Trial assessment in some scenarios can be extremely expensive. Assigning random subject to any group via trial assessment in some scenarios becomes unfeasible.
Observational study Pros and cons of observational study Cons Pros Common & simplest form of data gathering. Since observations are made in a perfectly natural setting, the study has the potential to reveal extremely deep & unexplored insights. Insights gained by observational study do not justify the amount of time spent to do so. Certain events may occur in the absence of the observer. Chances of misreporting observational details always exists. Study if not performed by expert, increases the chances of unfair conclusion important
Chapter 4: Randomization By the end of this chapter, students should be able to understand: Use of surveys to collect data Sampling bias Confidence interval Data collection by sensory devices Data from internet
What is a survey? A survey is a research method used to collect data where the subjects are generally people. In a survey, the process involves asking people for the information through a questionnaire. The outcome of a survey depends heavily on the type of questions asked. The questions should be carefully worded not to hurt the sentiment of the people being surveyed. Survey
Types of questions asked in a survey Surveys can be composed of two types of questions Open-ended questions where respondents answer the question in their own words. E.g., Comments/reviews Survey Close ended questions where the choice of answers from which to select is fixed and generally provided alongside the question. E.g., A rating scale of 1 to 10
What is sampling bias? Sampling bias is a type of discrimination in which a sample is collected so that some members of the considered population have a lower or a higher sampling chance than the others. This generates wrong results for the study. Sampling bias
What is confidence interval? Confidence interval In statistics, the term used to measure the accuracy of a result is called the confidence interval. A confidence interval communicates how accurate our estimate is likely to be.
What is a sensor? A sensor is a device that identifies and measures the change in input from a physical entity and converts them into signals. Sensors The generated signals can then be converted into human-readable displays. An example of sensor is the use of sensor based IoT in monitoring the proper functioning of machineries in an industrial plant. Data outputs generated by the sensor based IoT helps in understanding whether a machine is working properly or not.
How data can be gathered online? The internet can be considered as an ocean of data. Online DATA- mony There is an uncountable number of websites and web articles on the internet. All of these serve as a rich pool of data. Data can be collected from the internet using web data scraping, cleaning up the data, and then analyzing them.
Few things about XML XML stands for Extensible Markup Language Charm of XML XML is a self-descriptive tool to store and transport data on the internet. A simple XML is made up of tags, element names, and element values.
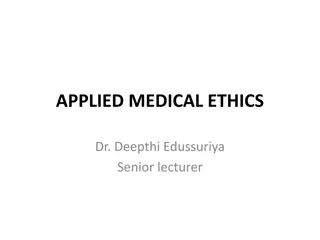
Charm of XML Consider having this table in a web page on the internet. The data shown in the table on the internet can be stored as an XML. Table highlighting upvotes for different types of pizzas
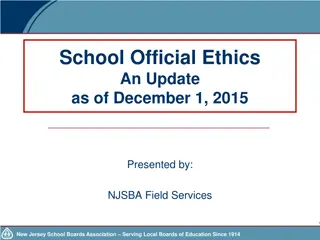
XML representation of the table shown before Charm of XML XML format makes it simple to display data on a web page. Converting XML to a data table format helps us visualize our data better.
Chapter 5: Introduction to R-Studio At the end of this chapter students will understand how data can be processed via software tools. They will know Orientation with R Studio Coding for Data science R-Studio Code examples with R-Studio
How to install R Studio. Getting familiarized with R Studio interface. Orientation with R Studio Setting working directory in R Studio. Read a CSV file in R Studio.
Data objects in R Vectors List Data objects in R Matrices Arrays Data Frames Factors
Vectors in R Vector is the most basic data object in R. Vectors in R It is a sequence of elements of the same data type. Different type of elements are coerced to a common type.
Vectors in R There are six basic vectors logical, integer, double, complex, character, and raw. Vectors in R When a person writes just one value in R, it becomes a vector of length one
List in R A list in R is a type of R object which contains different types of elements like - numbers, vectors, strings, and another list within it. List in R To create a list, we use the list() function. Example of list in R x <- list(name= Amar", nationality="Indian", height=5.5, marks=c(95,45,80))
Matrices in R Matrices are an extension of the numeric or character vectors. Matrices are atomic vectors arranged in a two-dimensional rectangular layout. Matrices in R Since matrix is an atomic vector extension, its elements must be of same data type. To create a matrix in R, we use the matrix() function.
Matrices in R The syntax for creating a matrix in R is: matrix(data, nrow, ncol, byrow, dimnames) The parameters used can be described as follows: data: the input vector which becomes the data elements of the matrix. nrow: number of rows to be created. ncol: number of columns to be created. byrow represents a logical clue. When set to TRUE, then the elements in input vector are organized by row. dimname is the names assigned to the rows and columns. Matrices in R
Matrices in R Examples of Matrices in R: y <- matrix(1:20, nrow = 4, ncol = 5) Matrices in R M <- matrix(c(2:13), nrow = 3, byrow = FALSE) M <- matrix(c(2:13), nrow = 3, byrow = TRUE)
Matrices in R For matrices in R, column names and row names can be defined as shown below: Matrices in R rownames = c( row1 , row2 , row3 ) colnames = c( col1 , col2 , col3 , col4 ) p <- matrix(c(2:13), nrow = 3,byrow=TRUE, dimnames=list(rownames,colnames) )
Arrays in R Arrays are the R data objects in which we can store data in more than two dimensions. So, if we create an array of dimensions (4,5,2), it will create two rectangular matrices, each with four rows and five columns. Arrays in R Arrays can store only data types.
Arrays in R An array is created using the array() function. The array() function takes vectors as input and uses the dim parameter values to create an array. Arrays in R Shown below is a simple example of how to create an array using vectors: vector1 <- c(6,4,1) vector2 <- c(9,12,15,16,14,11) result <- array(c(vector1,vector2), dim = c(3,3,2))
Factors in R In R, factors are the data objects used to categorize the data and store it as levels. Factors can store both strings and integers. Factors are generally used in columns that have a finite number of unique values. Factors in R Factors are helpful in the data analysis for statistical modeling. Factors in R are created using the factor() function. The input parameter for this function is a vector.
Data Frames in R In R, a data frame can be defined as a table- like structure used to store data. In a data frame, each column contains the values of each variable. Each row contains one set of values related to each column. In a data frame, the column names are non- empty, and the row names should be unique. Data frames are made up of data that are of numeric, factor, or character data type. To create a data frame, we use the data.frame() function. Data Frames in R
Data Frames in R
Data Frames in R