Understanding Atmospheric Thermodynamics and Environmental Lapse Rate
Explore the concepts of atmospheric thermodynamics including the Parcel Method, Environmental Lapse Rate, and Conditionally Unstable Atmosphere. Dive into the details of how air parcels behave in different atmospheric conditions and understand the significance of temperature changes in the atmosphere. Gain insights into the stability of the atmosphere based on the behavior of air parcels as they rise or fall.

Download Presentation

Please find below an Image/Link to download the presentation.
The content on the website is provided AS IS for your information and personal use only. It may not be sold, licensed, or shared on other websites without obtaining consent from the author. Download presentation by click this link. If you encounter any issues during the download, it is possible that the publisher has removed the file from their server.
E N D
Presentation Transcript
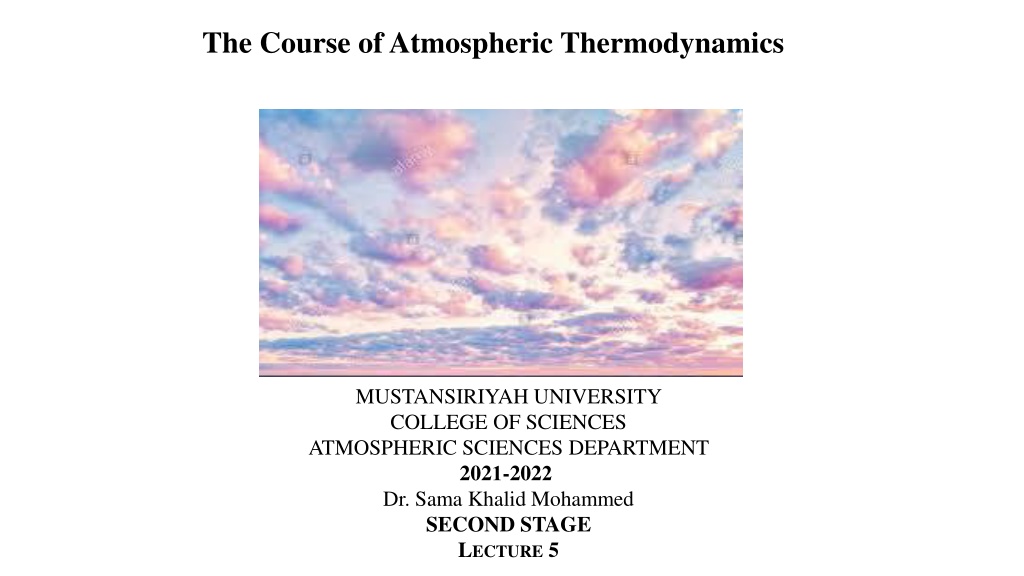
The Course of Atmospheric Thermodynamics MUSTANSIRIYAH UNIVERSITY COLLEGE OF SCIENCES ATMOSPHERIC SCIENCES DEPARTMENT 2021-2022 Dr. Sama Khalid Mohammed SECOND STAGE LECTURE 5
This lecture including the following items The Parcel Method Environmental Lapse Rate Conditionally Unstable Atmosphere Exercises Thermodynamic Diagrams
The Parcel Method The parcel is initially a part of the atmosphere, not different from any other at the same level. But it becomes an individualized portion as soon as it is assumed to start a displacement, while the environment remains at rest. The variables of the parcel will be distinguished by a prime (e.g., T') from those of the environment (T). A number of simplifying assumptions are adopted in this method. It is supposed that: (1) the parcel maintains its individuality during its movement, without mixing with the surrounding air, (2) the movement of the parcel does not disturb the environment, (3) the process is adiabatic, and (4) at every instant the pressures of the parcel and of the environment for a given level are equal.
Environmental Lapse Rate The environmental lapse rate is referred to as the rate at which the air temperature surrounding us (or the air parcels) would be changed if we were to climb upward into the atmosphere. A rawinsonde s thermometer measures the environmental lapse rate. The environmental (or ambient) lapse rate is referred to the vertical change in temperature through still air. The environmental lapse rate is not fixed. It changes from day to day and from place to place.
Conditionally Unstable Atmosphere Suppose an unsaturated (but humid) air parcel is somehow forced to rise from the surface. As the parcel rises, it expands, and cools at the dry adiabatic rate until its air temperature cools to its dew point. At this level, the air is saturated, the relative humidity is 100 percent, and further lifting results in condensation and the formation of a cloud. The elevation above the surface where the cloud first forms (in this example, 1000 meters) is called the condensation level. Notice that above the condensation level, the rising saturated air cools at the moist adiabatic rate. Notice also that from the surface up to a level near 2000 meters, the rising, lifted air is colder than the air surrounding it. The atmosphere up to this level is stable.
Conditionally Unstable Atmosphere However, due to the release of latent heat, the rising air near 2000 meters has actually become warmer than the air around it. Since the lifted air can rise on its own accord, the atmosphere is now unstable. The level in the atmosphere where the air parcel, after being lifted, becomes warmer than the air surrounding it, is called the level of free convection. The atmospheric layer from the surface up to 4000 meters has gone from stable to unstable because the rising air was humid enough to become saturated, form a cloud, and release latent heat, which warms the air.
Conditionally Unstable Atmosphere Had the cloud not formed, the rising air would have remained colder at each level than the air surrounding it. From the surface to 4000 meters, we have what is said to be a conditionally unstable atmosphere the condition for instability being whether or not the rising air becomes saturated. Therefore, conditional instability means that, if unsaturated stable air is somehow lifted to a level where it becomes saturated, instability may result. the environmental lapse rate is 9 C per 1000 meters. This value is between the dry adiabatic rate (10 C/1000 m) and the moist adiabatic rate (6 C/1000 m). Consequently, conditional instability exists whenever the environmental lapse rate is between the dry and moist adiabatic rates.
Exercise 1 Q1/ A dry air parcel has a temperature of 20 C. The environmental lapse rate is 5 C/km, and the dry adiabatic lapse rate is 10 C/km, the air parcel is forced to rise over a mountain that is 3 km high. 1. What is the temperature of the air parcel at the top of the mountain? ( ans. -10 C) 2. What is the temperature of the environment at the top of the mountain? (ans. 5 C) 3. What is the buoyant acceleration of the air parcel at the top of the mountain? (-30 m/s2) 4. Is the atmosphere stable or unstable? and why?
Exercise 2 Q2/ For the following data, Altitude (m) 1480 5700 Pressure (hPa) 850 500 Temp ( C) 7 -15 ( K) ? ? 1. Find the potential temperature (in kelvin) at the two altitudes, cp = 1005 J/ kg K, and Rd = 287.1 J/kg K. 2. Is the atmosphere stable or unstable?
Why We Use Thermodynamic (Areological)Diagrams? They are used to graphically display the relation between two of the thermodynamic variables T, V, and p. Process lines represent specific thermodynamic processes on the diagram, including: Isotherms, Isobars, Adiabats, Pseudoadiabats, Isohumes. When an air parcel undergoes a reversible process, the succession of states is represented on the thermodynamic diagram by a curve. A cyclic process is represented by a closed curve. On some charts the area so enclosed is directly proportional to the work done in the process.
What are the Properties of a Useful Thermodynamic Diagrams? A useful thermodynamic diagram should have the following general properties The area enclosed by a cyclic process should be proportional to the work done during the process. As many of the process lines as possible should be straight. The angle between the isotherms and adiabats should be as close to 90 as possible. Because equal area represents equal energy on any point on the diagram, a true thermodynamic diagram has an Area and Energy
What are the Types of Diagrams? Some of the types of the Thermodynamic Diagrams are: Emagram Tephigram SkewT/Log P diagram (modified emagram) Psuedoadiabatic (or St ve) diagram
How to create a Useful diagram for Meteorologist? We can create a diagram with area proportional to work usingthe p- diagram. Since work per unit mass is defined as dw = - p d , the area on a p- (Clapeyron) diagram is proportional to work. But this diagram is not very useful for meteorologists because The angle between isotherms and adiabats is very small Process lines aren t very straight Volume is not a convenient thermodynamic variable for meteorology.
How to create a Useful diagram for Meteorologist? For meteorology it would be useful to have a diagram that uses T and p as the thermodynamic variables. However, we can t just arbitrarily use T and p and hope that area will be proportional to work. We have to find a way of setting up the axes of our diagram so that area will be proportional to work.
What is The EMAGRAM? What are the Properties of its Lines? The diagram) is created by letting X = T, and by using the equation of state for dry air with some mathematical processes we get the diagram axes: X=T , Y= - Rd ln P The properties of the lines in EMAGRAM are: Isotherms are straight vertical lines. Isobars are straight, horizontal lines. Adiabats are slightly curved, concave upward. Pseudoadiabats are curved convex upward. Isotherm adiabat angle varies with axis scale, but is usually about 45 . EMAGRAM (energy-per-unit-mass
STUVE (Pseudo-Adiabatic) DIAGRAM we can look at the following equation of potential temperature graphically, then we will get e.g., the Pseudo-Adiabatic chart . 0 286 . 0 0 286 p p 0 p = = . 0 286 T p T Re-arrange: p0.286 on y-axis, T on x-axis For a constant , (p00.286/ ) is also a constant, so the graph yields a straight line with gradient given by (p00.286/ ), and passing through T=0 and p=0
STUVE (Pseudo-Adiabatic) DIAGRAM Earth s atmosphere y-axis is linear for p0.286 also linear for ln(p) Isobars are straight, horizontal lines Isotherms are straight, vertical lines Adiabats are straight, sloping lines toward the upper left
STUVE (Pseudo-Adiabatic) DIAGRAM isotherms are vertical and dry adiabats (constant ) are oriented at an acute angle relative to isotherms. Because changes in temperature with height in the atmosphere generally lie between isothermal and dry adiabatic, most temperature soundings lie within a narrow range of angles when plotted on a pseudo-adiabatic chart. Advantage: we can follow each line and determine graphically temperature at any pressure, assuming adiabatic expansion / compression. Disadvantage: Everything happens in small region of the chart.
Skew T ln P chart This restriction is overcome in the so-called skew T -ln p chart, in which the ordinate (y) is ln p and the abscissa (x) is x=T+(constant)y = T-(constant)ln p So y=(x T)/(constant), i.e. x = T + klnP , y = -R lnP Where k is adjusted to make the angle between isotherms and dry adiabats nearly 90 o. and for an isotherm T is constant, the relationship between y and x for an isotherm is of the form y = mx + c, where m is the same for all isotherms and c is a different constant for each isotherm. Therefore, on the skew T - ln p chart, isotherms are straight parallel lines that slope upward from left to right.
Skew T ln P chart Isobars are straight, horizontal lines Isotherms are straight, sloping lines (toward the upper right). Adiabats are nearly straight, sloping lines (toward the upper left). The isotherm adiabat angle is nearly 90 , Therefore, when atmospheric temperature soundings are plotted on this chart, small differences in slope are more apparent than they are on the pseudoadiabatic chart.
What are all the lines on the skew T-ln p chart? isobar isotherm dry adiabat saturated adiabat saturation mixing ratio
Dry Adiabats and Moist or Pseudo Adiabats Dry Adiabats lines represent the change in temperature that an unsaturated air parcel would undergo if moved up and down in the atmosphere. Pseudo or moist Adiabatic Lines usually curves portray the temperature changes that occur upon a saturated air parcel when vertically displaced. Saturation adiabats appear on the thermodynamic diagram as a set of curves with slopes ranging from 0.2C /100 m in warm air near the surface to that approaching the dry adiabats (1C /100 m) in cold air aloft, why?
These curved lines increase in value from left to right. Moist adiabats represent the rate at which saturated air cools (lapses) as it rises. When the air is at 100% relative humidity, further cooling causes water vapor to condense. In this condensation process, heat is released which then affects the rate of cooling and these lines represent that rate. Near the surface, as saturated air rises, it expands and begins to cool at a rate of about 4 C per 1,000 meters. As it continues to rise, the cooling rate decreases due to a decreasing amount of water vapor. On the Skew-T the dry and wet adiabats become nearly parallel in the upper troposphere where the rate of cooling approaches that of dry adiabats, nearly 9.8C/1,000 meters . Very cold air does not contain much water vapor. The reason is because as air cools, the temperature of the water vapor itself decreases leading to an increasing amount vapor condensing to a liquid (or deposits to a solid) state. This condensation and/or deposition decreases the amount of gaseous water remaining in the atmosphere. In very cold air, most of the water vapor has already condensed into a liquid or deposited into a solid. The end result is very cold air contains little water vapor and therefore cannot release much heat into the atmosphere. Conversely, very warm air can contain large amounts of water vapor. Warming air means the temperature of the water vapor increases so evaporation and/or sublimation (changing from liquid or solid to a gas) also increases. This adds water vapor to the atmosphere.


")

Diagrams?")


 DIAGRAM")
 DIAGRAM")
 DIAGRAM")