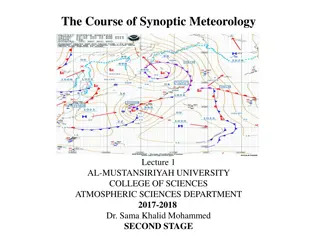
Understanding Basic Meteorology Concepts for Air Quality Management
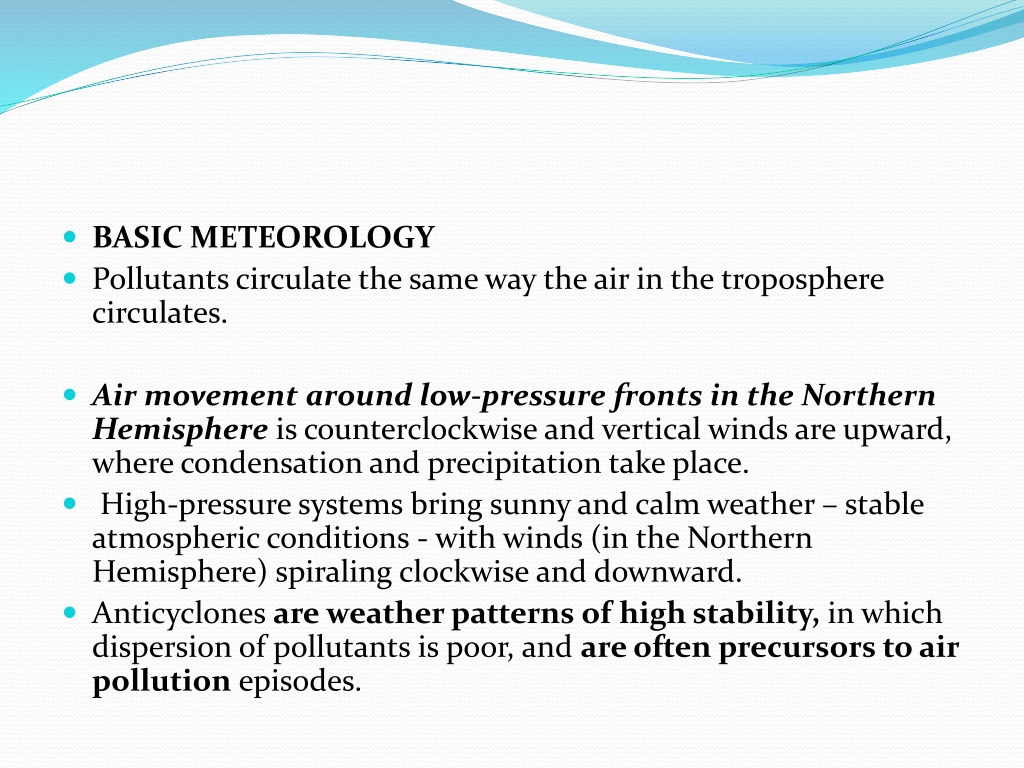


BASIC METEOROLOGY
Pollutants circulate the same way the air in the troposphere
circulates.
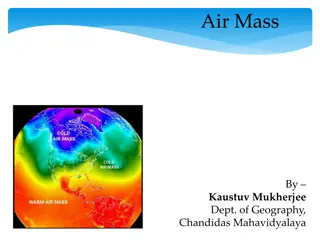
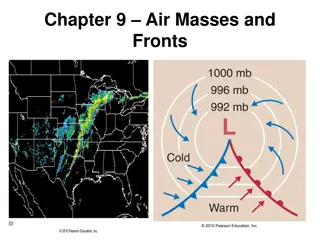
Air movement around low-pressure fronts in the Northern
Hemisphere
is counterclockwise and vertical winds are upward,
where condensation and precipitation take place.
High-pressure systems bring sunny and calm weather – stable
atmospheric conditions - with winds (in the Northern
Hemisphere) spiraling clockwise and downward.
Anticyclones
are weather patterns of high stability,
in which
dispersion of pollutants is poor, and
are often precursors to air
pollution
episodes.
High- and low-pressure systems, are
commonly called anticyclones and
cyclones.
Anticyclones
Are weather patterns of high
stability
Have poor dispersion of
pollutants
Are often precursors to air
pollution episodes.
Vertical dispersion
The rate at which
dry
air cools as it rises is
called the
dry
adiabatic lapse rate
dry
adiabatic lapse rate is independent of the
ambient air temperature.
The
dry adiabatic lapse rate :
where T = temperature and z = altitude.
The actual measured rate at which
air cools as it rises
is called the
ambient or prevailing lapse rate.
The relationships between the ambient lapse
rate and the dry
adiabatic lapse rate essentially
determine the stability of the air and the speed
with which pollutants will disperse.
Neutral stability:
w
hen the ambient lapse rate is
exactly the same as the
dry adiabatic lapse rate
Neutral stability conditions usually result in
coning plumes
Super-adiabatic
:
when the air
temperature drops
more than
9.8
o
C/km
Super-adiabatic
atmospheric conditions are
unstable and favor dispersion
A looping plume also produces high ground-
level concentrations
Sub-adiabatic conditions:
when the air
temperature drops at a rate less than
9.8
o
C/km.
A special case of
sub-adiabatic conditions is
the
temperature inversion, when the air
temperature actually
increases with altitude
and a layer of warm
air exists over a layer of
cold air.
Sub-adiabatic conditions are stable and result
in poor dispersion;
Inversions are extremely stable and trap
pollutants, inhibiting dispersion.
Under stable (subadiabatic) conditions, the fanning
plume
tends to spread out in a single flat layer.
Fumigation: pollutants are caught under an inversion
and are mixed owing to a
strong lapse rate
ATMOSPHERIC DISPERSION
Dispersion is the process by which contaminants
move through the air and a plume spreads over a
large area, thus reducing the concentration of the
pollutants it contains.
The plume spreads both horizontally and
vertically.
The most commonly used model for the dispersion
of gaseous air pollutants is the Gaussian model
Assumptions
The predominant force in pollution transport
is the wind;
Pollutants move downwind
The greatest concentration of pollutant
molecules is along the plume center line.
Molecules diffuse spontaneously from regions
of higher concentration to regions of lower
concentration
The pollutant is emitted continuously, and the
emission and dispersion process is steady
state.
The Gaussian Dispersion Model
Where:
C(x, y, z) is the concentration at some point in space
with coordinates x, y, z in
g/m
3
Q = the emission rate of the pollution source (in g/s),
u = the average wind speed in ( m/ s ) ,
y
= the standard deviation of the plume in the y
direction (m)
z
= the standard deviation of the plume in the
z
direction (m)
At ground level, the above equation reduces to (z=0):
The greatest value of the concentration is along the
plume centerline (y=0)
The standard deviations
y
, and
z
, are
measures of the plume spread in the
crosswind (lateral) and vertical directions,
respectively.
They depend on atmospheric stability and
on distance from the source.
Atmospheric stability is classified in
stability classes/ categories A through F.
Stability classes
Class A is the least stable;
Class F is the most stable.
Classes A, B, and C are associated with super-adiabatic
conditions;
Class D with neutral conditions;
and Classes E and F with sub-adiabatic conditions.
Class G, indicates conditions of extremely severe
temperature inversion, but in considering frequency of
occurrence is usually combined with Class F.
Urban and suburban populated areas rarely achieve
stability greater than Class D, because of the heat island
effect;
stability classes E and F are found in rural and unpopulated
areas.
Atmospheric stability
Standard deviation or dispersion coefficient,
y
, in the
crosswind
direction as a function of downwind distance
Standard deviation or dispersion coefficient,
z
, in the
vertical direction
as a function of downwind distance
Variation of Wind Speed With Elevation
Wind direction shifts and wind speed varies with time
and elevation.
The variation of wind speed with elevation can be
approximated by a parabolic wind velocity profile:
The exponent
n, called the stability parameter, is an
empirically determined function
of the atmospheric
stability, and
is given in T
Effective Stack Height
The effective stack height is the sum of stack height
and the height, above the stack to which the plume
rises before dispersing downwind,
h:
For super-adiabatic conditions:
For neutral stability:
For sub-adiabatic conditions:
Where:
V
s
= stack gas exit speed (in
m/s ) ,
d = stack diameter (in m), and
Q
h
= heat emission rate from the stack (in kJ/s)
A useful formula for estimating worst case mean
concentrations downwind of a point source is the following
equation suggested by Hanna et al.
where:
Q = source strength or emission rate of gas or particulate
[kg/s]
C
wc
= worst case concentration [μg/m
3
]
U = worst case wind speed at height z = 10 m, usually 1 m/s
W
wc
=
y ,
worst case cloud width [m] (usually assume W =
0.1x, where x is distance from the source)
H
wc
=
z ,
worst case cloud depth (usually assume H = 50 m
in worst case)
Pollutants circulate in the troposphere following air movement patterns around low-pressure fronts and high-pressure systems. Anticyclones and cyclones play a crucial role in atmospheric stability and pollutant dispersion. The relationship between lapse rates determines air stability and pollutant dispersion speed. Different stability conditions such as neutral, super-adiabatic, and sub-adiabatic impact air quality and pollutant concentrations.

Download Presentation

Please find below an Image/Link to download the presentation.
The content on the website is provided AS IS for your information and personal use only. It may not be sold, licensed, or shared on other websites without obtaining consent from the author. Download presentation by click this link. If you encounter any issues during the download, it is possible that the publisher has removed the file from their server.
E N D
Presentation Transcript
BASIC METEOROLOGY Pollutants circulate the same way the air in the troposphere circulates. Air movement around low-pressure fronts in the Northern Hemisphere is counterclockwise and vertical winds are upward, where condensation and precipitation take place. High-pressure systems bring sunny and calm weather stable atmospheric conditions - with winds (in the Northern Hemisphere) spiraling clockwise and downward. Anticyclones are weather patterns of high stability, in which dispersion of pollutants is poor, and are often precursors to air pollution episodes.
High- and low-pressure systems, are commonly called anticyclones and cyclones.
Anticyclones Are weather patterns of high stability Have poor dispersion of pollutants Are often precursors to air pollution episodes.
Vertical dispersion The rate at which dry air cools as it rises is called the dry adiabatic lapse rate dry adiabatic lapse rate is independent of the ambient air temperature. The dry adiabatic lapse rate : where T = temperature and z = altitude. The actual measured rate at which air cools as it rises is called the ambient or prevailing lapse rate.
The relationships between the ambient lapse rate and the dry adiabatic lapse rate essentially determine the stability of the air and the speed with which pollutants will disperse.
Neutral stability: when the ambient lapse rate is exactly the same as the dry adiabatic lapse rate Neutral stability conditions usually result in coning plumes
Super-adiabatic: when the air temperature drops more than 9.8oC/km Super-adiabatic atmospheric conditions are unstable and favor dispersion A looping plume also produces high ground- level concentrations
Sub-adiabatic conditions: when the air temperature drops at a rate less than 9.8oC/km. A special case of sub-adiabatic conditions is the temperature inversion, when the air temperature actually increases with altitude and a layer of warm air exists over a layer of cold air. Sub-adiabatic conditions are stable and result in poor dispersion; Inversions are extremely stable and trap pollutants, inhibiting dispersion.
Under stable (subadiabatic) conditions, the fanning plume tends to spread out in a single flat layer. Fumigation: pollutants are caught under an inversion and are mixed owing to a strong lapse rate
ATMOSPHERIC DISPERSION Dispersion is the process by which contaminants move through the air and a plume spreads over a large area, thus reducing the concentration of the pollutants it contains. The plume spreads both horizontally and vertically. The most commonly used model for the dispersion of gaseous air pollutants is the Gaussian model
Assumptions The predominant force in pollution transport is the wind; Pollutants move downwind The greatest concentration of pollutant molecules is along the plume center line. Molecules diffuse spontaneously from regions of higher concentration to regions of lower concentration The pollutant is emitted continuously, and the emission and dispersion process is steady state.
Where: C(x, y, z) is the concentration at some point in space with coordinates x, y, z in g/m3 Q = the emission rate of the pollution source (in g/s), u = the average wind speed in ( m/ s ) , y= the standard deviation of the plume in the y direction (m) z= the standard deviation of the plume in the z direction (m)
At ground level, the above equation reduces to (z=0): The greatest value of the concentration is along the plume centerline (y=0)
The standard deviations y, and z, are measures of the plume spread in the crosswind (lateral) and vertical directions, respectively. They depend on atmospheric stability and on distance from the source. Atmospheric stability is classified in stability classes/ categories A through F.
Stability classes Class A is the least stable; Class F is the most stable. Classes A, B, and C are associated with super-adiabatic conditions; Class D with neutral conditions; and Classes E and F with sub-adiabatic conditions. Class G, indicates conditions of extremely severe temperature inversion, but in considering frequency of occurrence is usually combined with Class F. Urban and suburban populated areas rarely achieve stability greater than Class D, because of the heat island effect; stability classes E and F are found in rural and unpopulated areas.
Standard deviation or dispersion coefficient, y, in the crosswind direction as a function of downwind distance
Standard deviation or dispersion coefficient, z, in the vertical direction as a function of downwind distance
Variation of Wind Speed With Elevation Wind direction shifts and wind speed varies with time and elevation. The variation of wind speed with elevation can be approximated by a parabolic wind velocity profile: The exponent n, called the stability parameter, is an empirically determined function of the atmospheric stability, and is given in T
Effective Stack Height The effective stack height is the sum of stack height and the height, above the stack to which the plume rises before dispersing downwind, h: For super-adiabatic conditions: For neutral stability:
For sub-adiabatic conditions: Where: Vs= stack gas exit speed (in m/s ) , d = stack diameter (in m), and Qh= heat emission rate from the stack (in kJ/s)
A useful formula for estimating worst case mean concentrations downwind of a point source is the following equation suggested by Hanna et al. where: Q = source strength or emission rate of gas or particulate [kg/s] Cwc= worst case concentration [ g/m3] U = worst case wind speed at height z = 10 m, usually 1 m/s Wwc= y , worst case cloud width [m] (usually assume W = 0.1x, where x is distance from the source) Hwc= z ,worst case cloud depth (usually assume H = 50 m in worst case)


 conditions, the fanning")


:")