Understanding Thermodynamics: The Science of Energy Relations
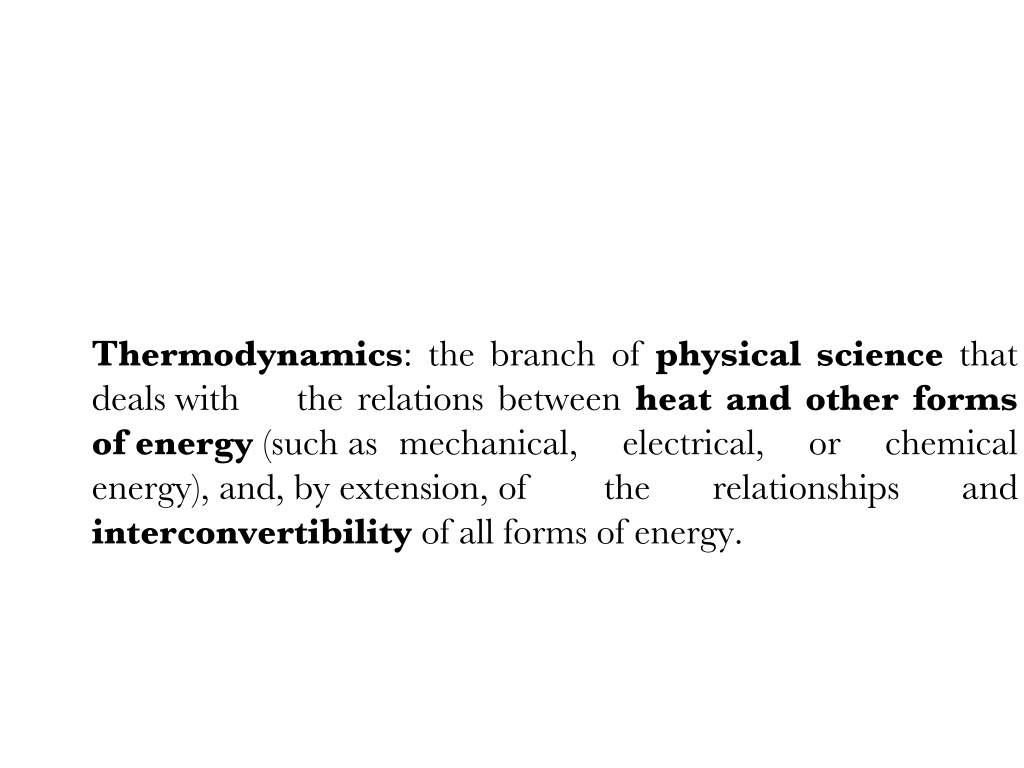
Thermodynamics is a branch of physical science that focuses on the relationships between heat and various forms of energy, exploring the interconvertibility of energy types. It involves the study of systems, surroundings, phases, components, and reactions, with a primary focus on macroscopic energies of microscopic processes. The First Law of Thermodynamics emphasizes the conservation of energy within isolated and closed systems. Intensive variables like pressure and temperature play a crucial role in thermodynamic studies.

Download Presentation

Please find below an Image/Link to download the presentation.
The content on the website is provided AS IS for your information and personal use only. It may not be sold, licensed, or shared on other websites without obtaining consent from the author. Download presentation by click this link. If you encounter any issues during the download, it is possible that the publisher has removed the file from their server.
E N D
Presentation Transcript
Thermodynamics: the branch of physical science that deals with the relations between heat and other forms of energy (such as mechanical, energy), and, by extension, of interconvertibility of all forms of energy. electrical, the or chemical relationships and
Some definitions A system is some part of the universe that you want to study and understand The surroundings are everything else in the universe that is not in our system The system can be openor closed to (isolated from) the surroundings in terms of both matter and energy Natural systems tend toward states of minimum energy
Some definitions The Phase is any mechanically separable and chemically homogenous portion of the system Component is minimum number of constituents required to describe system.
Some definitions In our case, a system is likely to be a mineral or a rock In this case, it is comprised of chemical components that describe chemical variability in that mineral or a rock Typical components might be FeO, MgO and SiO2 used to describe olivine A phase is any mechanically separable and chemically the system, e.g. a melt, a fluid, or a mineral in a rock homogenous portion of A reaction is anything that changes the nature of the phases within a system
Some definitions Thermodynamics is primarily concerned with macroscopic energies of microscopic processes that we might or might not fully understand. It is convenient to group all of the variables required into two classes: Intensivevariables are independent of the amount of material present: e.g. Pressure (P)& Temperature (T) Extensivevariables are dependent on the amount of material present: e.g. Volume (V) & Entropy (S)
The First Law of Thermodynamics states that "the internal energy, E, of an isolated system is constant". In a closed system, there cannot be a loss or gain of mass, but there can be a change in energy, dE. dE = dQ - dW (1) Q=heat W=work done by the system W=force x distance. Pressure, P= Force/surface area, Force = P x surface area, Therefore, W = P x surface area x distance = P x V V is volume. If the work is done at constant pressure, then dW = PdV. Substitution of this relationship into (1) yields: dE = dQ - PdV (2) This is a restatement of the first law of thermodynamics.
The Second Law of Thermodynamics states that the change in heat energy of the system is related to the amount of disorder in the system. Entropy is a measure of disorder, and so at constant Temperature and Pressure: dQ = TdS Thus, substituting into (2) we get: dE = TdS - PdV (3)
The Gibbs Free Energy, G, is defined as the energy in excess of the internal energy as follows: G = E + PV - TS (4) Differentiating this we get: dG = dE +VdP + PdV - TdS - SdT Substituting (3) into this equation then gives: dG = TdS - PdV + VdP + PdV - SdT - TdS or dG = VdP - SdT (5)
For a system in equilibrium at constant P and T, dG = 0. If we differentiate equation (5) with respect to P at constant T, the result is: (6) and if we differentiate equation (5) with respect to T at constant P we get: (7) Equation (6) tells us that phases with small volume are favored at higher pressure, and equation (7) tells us that phases with high entropy (high disorder) are favored at higher temperature.
Equation (5), dG = VdP SdT, tells us that the Gibbs Free Energy is a function of P and T. In the diagram, phase A has a steeply sloping free energy surface. Phase B has a more gently sloping surface. Where the two surfaces intersect, Phase A is in equilibrium with phase B, and GA = GB .
At constant P below TE phase A has the lowest Gibbs Free Energy, G. At these temperatures, phase A is stable and phase B is not stable because it has a higher free energy. Note that at TE the free energy of the phase A and B are same. At temperatures greater than T phase B has a lower free energy than phase A, and thus phase B is stable.
Next, we look at a section of G versus P at constant T. GA= GB at PE . At pressures greater than P phase B is stable because it has a lower G than phase A. At pressures less than PE phase A is stable because it has a lower G than phase B.
Finally, we look at a cross-section across the bottom of the first figure. Here we project the line of intersection of the Free Energy surfaces onto the P - T plane. Along the line of intersection of the surfaces GA= GB . The line separates two fields, one at low P in which A is the stable phase and one at higher P in which phase B B is stable. This is a classic P-T phase diagram. The line represents all values of P and T where
For reaction, A d G = VdP - SdT (8) G = the change in Gibbs Free Energy of the reaction S = the change in entropy of the reaction and V = the change in volume of the reaction B S= SPr- Sre V= VPr- VRe At equilibrium, as we have just seen, G = 0, so from equation (8) 0 = VdP - SdT
Rearranging this equation yields ( 9) This relation is known as the Clausius - Clapeyron Equation. It is important because it tells us the slope of the equilibrium boundary or reaction boundary on a Pressure versus Temperature phase diagram. We next look at two cases of chemical reactions. In the first case, the chemical reaction is between only solid phases. In the second case a fluid or gas is involved as one of the products of the reaction.
Solid - Solid Reactions Only involves solid phases, with no fluid phases. Most solid-solid reactions appear as straight lines on P-T diagrams. Why????? The reason for this comes from the Clausius-Clapeyronequation. dP/dT = S/ V As T increases, both S and V increase, disorganized at high temperature, high entropy, molecule vibrates more, high V Similarly, V tend to decrease with increasing pressure (less room to vibrate means better organization and lower volume). The change in volume and entropy at any given temperature and pressure tends to be small. A curve whose slope is constant is a straight line.
Let's use these principles to analyze some solid - solid reactions, such as those in the Al2SiO5 phase diagram. Note that for the solid-solid reaction Andalusite <=> Kyanite, dP/dT is positive. This is what we expect, because the product kyanite, occurs on the low T side of the reaction boundary Entropy for Ky low or high? S negative Increasing the pressure causes a decrease in volume, Volume for Ky low or high? V is also negative With both S and V megative, the slope
of the boundary curve dP/dT is positive. For the reaction Kyanite <=> Sillimanite, S is positive.-RIGHT??? V is also positive-????? is also positive.
Note that the reaction boundary for Andalusite <=> Sillimanite has a negative slope. V is negative or postive? S is positive or negative? dP/dT negative.
Devolatization Reactions Devolatilization reactions appear as curves on Pressure Temperature diagrams. A <=> B + H2O. For this reaction we can write: and S = SB + SH2O- SA = Ssolids+SH2O V = VB + VH2O- VA = Vsolids+ VH2O
Increasing temperature will generally cause S to be positive especially for this reaction in which a gas or fluid phase is produced, because gases always have a higher entropy (randomness) than solids. At low pressure V positive. At low pressure fluid or gas will expand to fill space available S = SB + SH2O- SA = Ssolids+SH2O V = VB + VH2O- VA = Vsolids+ VH2O dP/dT will be positive. As the pressure increases, the fluid or gas will be more compressible than the solids, so the total V will become increasingly smaller. Thus, dP/dT(= S/ V) will increase.
Another relationship that is useful is: G = H - TS where G is the Gibbs Free Energy, H is the enthalpy, T is the absolute temperature in Kelvin, and S is the entropy. For a chemical reaction, we can rewrite this as: G = H - T S (10) For a reaction Reactant=Product G = GPr- Gre S= SPr- Sre H= HPr- Hre In general G, H, S, and V are dependent of Pressure and Temperature, but at any given T & P: If G < 0 (negative) the chemical reaction will be spontaneous and run to the right, If G = 0 the reactants are in equilibrium with products, and if G > 0 (positive) the reaction will run from right to left.
G is a measure of relative chemical stability for a phase We can determine G for any phase by measuring H and S for the reaction creating the phase from the elements We can then determine G at any T and P mathematically Most accurate if know how V and S vary with P and T dV/dP is the coefficient of isothermal compressibility dS/dT is the heat capacity (Cp)
Temperature Dependence of G, H, and S As stated above, G, H, and S depend on Temperature and Pressure. But, because G depends on H and S, it is usually more convenient to consider the temperature dependence of H and S, so that if we know H and S at any given temperature, we can calculate G. where Cp is the heat capacity at constant pressure. The heat capacity is the amount of heat necessary to raise the temperature of the substance by 1oK.
CP can be expressed in terms of power series f T CP=a+bT-+c/T2............ (a+bT+c/T2) dT.............(13a) =a(T2- T1) + b(T22- T12)/2 - c/(T2-1- T1-1) Tables of thermodynamic data are usually tabulated at some known reference temperature and pressure, most commonly at a Temperature of 298 K, and Pressure of 1 bar ( = 0.1 MPa ~ 1atm). Thus, we if we need to know H at some temperature, T, other than 298 K, we can use the above equation to determine H at the new temperature: (T1 is 298K)
The temperature dependence of entropy, S, is given by: (a+bT+c/T2) dT.............(13b) a(ln T2 - ln T1) + b(T2 - T1) - c(T2-2 - T1-2)/2
NOT USED Exothermic vs. Endothermic If rH < 0 the reaction produces a reduction in enthalpy and is exothermic (heat is given up by the rock and gained by the surroundings). If rH > 0 the reaction produces an increase in enthalpy and is endothermic (heat from the surroundings is consumed by the rock). An easy way to remember this is that spontaneous reactions produce a decrease in internal energy, and because we know that EP HP a decrease in HP is also a decrease in EP.
Determining Enthalpies Thus, if we want to measure how the internal energy E of a crystal changes E with increasing temperature at constant pressure, we want to know H, and we can get that by integrating the heat capacity CP over the temperature range of interest. There's another way to measure H, though: calorimetry. By dissolving a mineral in acid and measuring the heat produced by the dissolution, we get a heat of dissolution (usually positive). The enthalpy of "formation" fH of the mineral is then just the opposite of the heat of dissolution (usually negative). Exceptions to the "usually positive/negative" rule include CN, HCN, Cu2+, Hg2+, NO, Ag+, and S2-. Enthalpies of formation appear in tables of thermodynamic data and are usually referenced to 298 K and 1 atm.
Enthalpy of Reaction To get an enthalpy of reaction rH we can measure the enthalpies of formation of the reactants and products fH and then take the difference between them as rH = fH products- fH reactants For example, we can compute the enthalpy of the reaction anhydrite + water = gypsum: CaSO4 + 2H2O = CaSO42H2O from Ca + S + 2O2 = CaSO4 fH = -1434.11 kJ/mol H2 + 0.5O2 = H2O fH = -285.830 kJ/mol Ca + S + 3O2 + 2H2 = CaSO42H2O fH = -2022.63 kJ/mol Thus, rH = fH gypsum - fH anhydrite - fH water = -16.86 kJ/mol.
Calculating fH at Temperatures Other Than 298 K So far we know how to calculate the change in enthalpy caused by heating and we know that we can get enthalpies of formation from tables. What if we want to know the enthalpy of formation of a mineral at a temperature other than 298 K? We do this by calculating rCP for the reaction that forms the mineral of interest: rCP = rCPproducts - rCPreactants and then integrating. Thus, for example if we want to know fH for quartz at 1000 K, we get coefficients for the heat capacities of Si, O2 and SiO2:
http://www.geol.ucsb.edu/faculty/hacker/geo 124T/lecture.html
NaAlSi3O8 = NaAlSi2O6 + SiO2 P - T phase diagram of the equilibrium curve How do you know which side has which phases? Figure 27.1. Temperature-pressure phase diagram for the reaction: Albite = Jadeite + Quartz calculated using the program TWQ of Berman (1988, 1990, 1991). Winter (2010) An Introduction to Igneous and Metamorphic Petrology. Prentice Hall.
pick any two points on the equilibrium curve d G = 0 = VdP - SdT dP dT = S V Thus Figure 27.1. Temperature-pressure phase diagram for the reaction: Albite = Jadeite + Quartz calculated using the program TWQ of Berman (1988, 1990, 1991). Winter (2010) An Introduction to Igneous and Metamorphic Petrology. Prentice Hall.
Gas Phases Return to dG = VdP - SdT, for an isothermal process: =z P 2 G G VdP P P 2 1 P 1 For solids it was fine to ignore V as f(P) For gases this assumption is shitty You can imagine how a gas compresses as P increases How can we define the relationship between V and P for a gas?
Gas Pressure-Volume Relationships Ideal Gas As P increases V decreases PV=nRT Ideal Gas Law P = pressure V = volume T = temperature n = # of moles of gas R = gas constant = 8.3144 J mol-1 K-1 Figure 5.5. Piston-and-cylinder apparatus to compress a gas. Winter (2010) An Introduction to Igneous and Metamorphic Petrology. Prentice Hall. P x V is a constant at constant T
Gas Pressure-Volume Relationships =z P 2 Since G G VdP P P 2 1 P 1 we can substitute RT/P for V (for a single mole of gas), thus: =z RT P z P P 2 G G dP P P 2 1 P 1 and, since R and T are certainly independent of P: 1 P = 2 G G RT dP P P P 2 1 1
Gas Pressure-Volume Relationships z 1 = And since dx ln x x GP2 - GP1 = RT ln P2 - ln P1 = RT ln (P2/P1) Thus the free energy of a gas phase at a specific P and T, when referenced to a standard atate of 0.1 MPa becomes: o GP, T - GT = RT ln (P/Po) G of a gas at some P and T = G in the reference state (same T and 0.1 MPa) + a pressure term
Gas Pressure-Volume Relationships The form of this equation is very useful o GP, T - GT = RT ln (P/Po) For a non-ideal gas (more geologically appropriate) the same form is used, but we substitute fugacity ( f ) for P wheref = P is the fugacity coefficient Tables of fugacity coefficients for common gases are available At low pressures most gases are ideal, but at high P they are not
Dehydration Reactions Mu + Q = Kspar + Sillimanite + H2O We can treat the solids and gases separately GP, T - GT = Vsolids (P - 0.1) + RT ln (P/0.1) (isothermal) The treatment is then quite similar to solid-solid reactions, but you have to solve for the equilibrium P by iteration


, dG = VdP – SdT, tells us that the Gibbs")