Noise Analysis of OSEM Actuator-Sensor Coupling
These slides detail the analysis of the coupling between the OSEM actuator and sensor, focusing on noise performance and assumptions made in the damping model. The measured open loop transfer functions and derivation of closed-loop noise transmission with OSEM coupling are discussed. Simulations and filters in Simulink are also presented to demonstrate the impact of coupling terms and damping filters on system performance.

Download Presentation

Please find below an Image/Link to download the presentation.
The content on the website is provided AS IS for your information and personal use only. It may not be sold, licensed, or shared on other websites without obtaining consent from the author. Download presentation by click this link. If you encounter any issues during the download, it is possible that the publisher has removed the file from their server.
E N D
Presentation Transcript
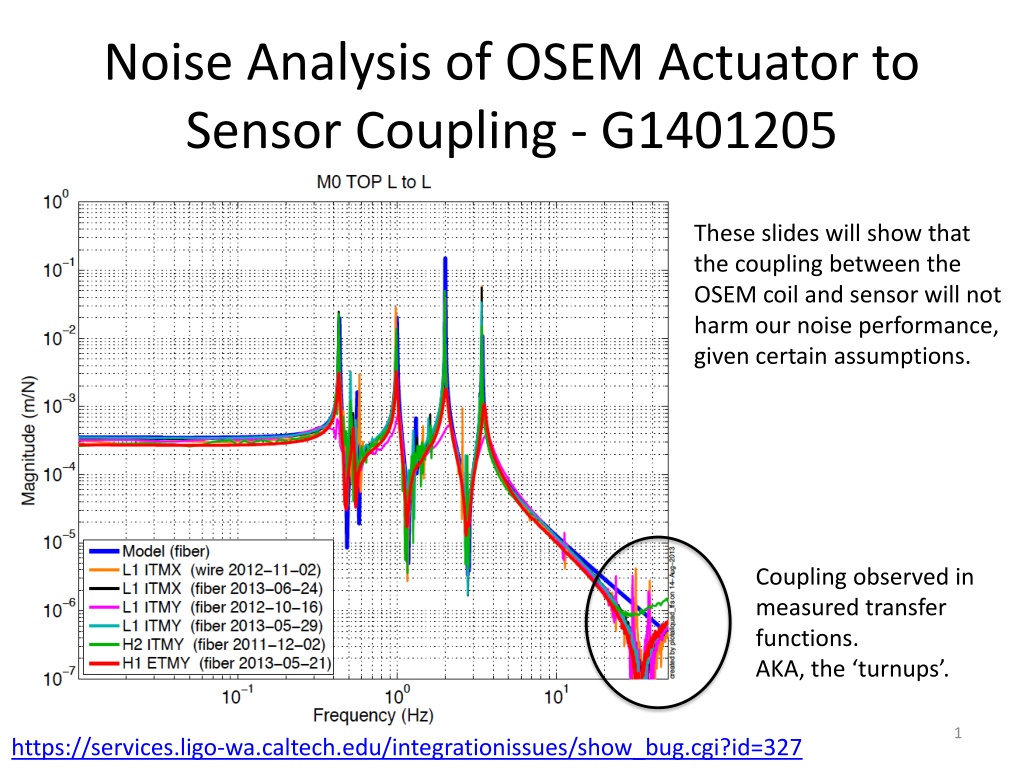
Noise Analysis of OSEM Actuator to Sensor Coupling - G1401205 These slides will show that the coupling between the OSEM coil and sensor will not harm our noise performance, given certain assumptions. Coupling observed in measured transfer functions. AKA, the turnups . 1 https://services.ligo-wa.caltech.edu/integrationissues/show_bug.cgi?id=327
Damping model with OSEM coupling Assumptions: The actuation signal couples to the sensor signal The sensor noise is summed after this coupling The coupling is linear e OSEM force output -D P y + Top mass displacement f B n OSEM sensor output s + P = top mass to top mass plant D = damping filter B = OSEM actuator to sensor coupling y = top mass displacement e = top mass TF excitation for measurements f = OSEM force s = OSEM sensor output n = OSEM sensor noise 2
The measured open loop TFs In this case the damping filter D = 0. So the sensor signal from an excitation is. s=Pe+Be The measured top mass to top mass TF is then s e= P+B Simulated top mass L to top mass L TF = (P+B) If 0.004 The notch sometimes seen in the TFs B = ----------------- (s+1000*2*pi) This shape has the right phase to generate the notch feature. However, LHO alog 1753 shows an f^1 shape. We ll see the shape does not matter for noise in general. 3
Derivation of closed loop noise transmission with OSEM coupling - It helps to reference the block diagram on slide 2 for this slide. s=n+y+Bf y=-PDs f =-Ds s=n-PDs-BDs s 1+PD+BD ( Measured closed loop displacement with OSEM sensor The top mass displacement, y, expressed in terms of s The damping force, f, expressed in terms of s Plugging y and f back in )=n Factoring out the sensor signal s 1 s= 1+PD+BDn -PD 1+ P+B ( The measured closed loop TF between sensor noise and sensor y=-PDs Then plugging gives us the top mass performance y= * Key Result: OSEM sensor noise to top mass displacement TF with OSEM coupling. This results suggests the shape of B is unimportant, provided (P+B)*D is less than 1 outside the damping band. )Dn 4
Simulink check A closed loop simulation with the coupling term B and damping filter D on slide 6. 5
Filters in the Simulink simulation D damp = 1e05 s (s+8.162) (s+0.9069) ---------------------------------- (s+15*2*pi)^2 (s^2 + 1.814s + 7.402) Velocity damping with a two pole roll-off at 15 Hz and a resgain bump at the 0.43 Hz mode. Simulated top mass L to top mass L TF = (P+B) B coupling = 0.004 -------- (s+1000*2*pi) 6
Top mass loop gain in simulink Showing the loop gain P*D to provide some sense of the damping design and performance. 7
Simulink result: Top mass displacement from OSEM sensor noise with various gains on the coupling The OSEM coupling B in general has negligible influence on the top mass displacement. In the extreme case where B is very large, red, the top mass displacement is actually suppressed. 8