Analysis of Trip Rates Variation in TRICS Consortium by Owen Edwards

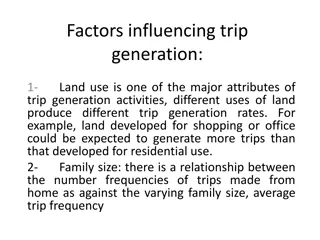
An analysis by TRICS Consortium, led by Owen Edwards, delved into trip rates variation, revealing minor and inconsistent variations in factors influencing trip rates, such as location type, local population, and public transport levels. The research focused on major location types and popular land uses to provide valuable insights for users seeking guidance on survey samples and trip rates adjustments.

Download Presentation

Please find below an Image/Link to download the presentation.
The content on the website is provided AS IS for your information and personal use only. It may not be sold, licensed, or shared on other websites without obtaining consent from the author. Download presentation by click this link. If you encounter any issues during the download, it is possible that the publisher has removed the file from their server.
E N D
Presentation Transcript
LOCATION TYPE TRIP RATES VARIATION IN TRICS OWEN EDWARDS TRICS CONSORTIUM
Often brought up by users requesting guidance on trip rates survey samples TRICS has undertaken an analysis to feed into an update on our guidance for users OWEN EDWARDS TRICS CONSORTIUM
New research began in 2018, looking at regional trip rates variation Current research in 2019 has looked at location type trip rates variation A technical note will be produced later this year to cover both aspects OWEN EDWARDS TRICS CONSORTIUM
2018 research indicated no evidence for fundamental direct influences on trip rates, with only minor and inconsistent variations identified which may have a variety of causes A number of other factors can influence trip rates variation, such as location type, local population, public transport levels, etc OWEN EDWARDS TRICS CONSORTIUM
TRICS LOCATION TYPES OWEN EDWARDS TRICS CONSORTIUM
OWEN EDWARDS TRICS CONSORTIUM
Looking at the largest survey sample possibilities results in three major location types to focus on 1 Town Centre/Edge of Town Centre 2 Suburban Area 3 Edge of Town OWEN EDWARDS TRICS CONSORTIUM
LAND USES OWEN EDWARDS TRICS CONSORTIUM
Most popular land uses selected 01/A Food Superstore 02/A Office 03/A Houses Privately Owned OWEN EDWARDS TRICS CONSORTIUM
01/A Food Superstore split into Friday only and Saturday only surveys 02/A Office and 03/A Houses Privately Owned will use only weekday surveys OWEN EDWARDS TRICS CONSORTIUM
SELECTION PARAMTERS OWEN EDWARDS TRICS CONSORTIUM
As many surveys wanted to keep the samples as large as possible Vehicles Only surveys Looking at surveys from the past 20 years, minimum date set to 01/01/1999 OWEN EDWARDS TRICS CONSORTIUM
01/A FOOD SUPERSTORE FRIDAY RESULTS OWEN EDWARDS TRICS CONSORTIUM
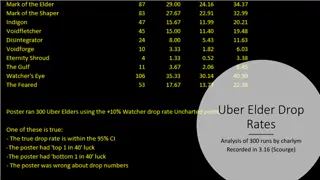
01/A FOOD SUPERSTORE FRIDAY TRICS Location Types 3 Edge of Town 2 Suburban Area 1 Town Centre/Edge of Town Centre Surveys (59) 26 20 13 Peak Totals (11.661) 12.542 11.510 9.757 Results per 100m OWEN EDWARDS TRICS CONSORTIUM
01/A FOOD SUPERSTORE FRIDAY TRICS Location Types 3 Edge of Town 2 Suburban Area 1 Town Centre/Edge of Town Centre Surveys (59) 26 20 13 Trips Totals (139.976) 149.839 141.898 102.822 Results per 100m OWEN EDWARDS TRICS CONSORTIUM
This sample shows Edge of Town with generally higher trip rates for both peak totals and trips totals Town Centre/Edge of Town Centre shows generally lower trip rates for both peak totals and trips totals OWEN EDWARDS TRICS CONSORTIUM
01/A FOOD SUPERSTORE SATURDAY RESULTS OWEN EDWARDS TRICS CONSORTIUM
01/A FOOD SUPERSTORE SATURDAY TRICS Location Types 3 Edge of Town 2 Suburban Area 1 Town Centre/Edge of Town Centre Surveys (78) 34 28 17 Peak Totals (12.675) 13.396 12.007 11.802 Results per 100m OWEN EDWARDS TRICS CONSORTIUM
01/A FOOD SUPERSTORE SATURDAY TRICS Location Types 3 Edge of Town 2 Suburban Area 1 Town Centre/Edge of Town Centre Surveys (78) 34 28 17 Trips Totals (142.637) 145.308 142.528 120.902 Results per 100m OWEN EDWARDS TRICS CONSORTIUM
These data samples show a similar pattern of results to the 01/A Food Superstore Friday results Edge of Town shows generally higher trip rates with Town Centre/Edge of Town Centre showing generally lower trip rates OWEN EDWARDS TRICS CONSORTIUM
02/A OFFICE WEEKDAY RESULTS OWEN EDWARDS TRICS CONSORTIUM
02/A OFFICE WEEKDAY TRICS Location Types 3 Edge of Town 2 Suburban Area 1 Town Centre/Edge of Town Centre Surveys (130) 28 29 73 Peak Totals (0.734) 0.997 0.714 0.601 Results per 100m OWEN EDWARDS TRICS CONSORTIUM
02/A OFFICE WEEKDAY TRICS Location Types 2 Suburban Area 3 Edge of Town 1 Town Centre/Edge of Town Centre Surveys (130) 29 28 73 Trips Totals (10.771) 11.813 11.222 7.690 Results per 100m OWEN EDWARDS TRICS CONSORTIUM
Peak totals show a similar pattern of results to both 01/A Food Superstore sets of results However, trips totals show Suburban Area having slightly higher trip rates than Edge of Town OWEN EDWARDS TRICS CONSORTIUM
03/A HOUSES PRIVATELY OWNED WEEKDAY RESULTS OWEN EDWARDS TRICS CONSORTIUM
03/A HOUSES PRIVATELY OWNED TRICS Location Types 3 Edge of Town 2 Suburban Area 1 Town Centre/Edge of Town Centre Surveys (192) 90 81 21 Peak Totals (0.595) 0.616 0.574 0.560 Results per dwelling OWEN EDWARDS TRICS CONSORTIUM
03/A HOUSES PRIVATELY OWNED TRICS Location Types 3 Edge of Town 1 Town Centre/Edge of Town Centre 2 Suburban Area Surveys (192) 90 21 81 Trips Totals (6.975) 7.102 5.766 5.010 Results per dwelling OWEN EDWARDS TRICS CONSORTIUM
Peak totals show a similar pattern of results to all 01/A Food Superstore and 02/A Office sets of results Trips totals show Suburban Area having slightly lower trip rates than Town Centre/Edge of Town Centre OWEN EDWARDS TRICS CONSORTIUM
CROSS LAND USE RESULTS OWEN EDWARDS TRICS CONSORTIUM
CROSS LAND USE RANKINGS TRICS Location Types 1 Town Centre/Edge of Town Centre 2 Suburban Area 3 Edge of Town 01/AF 3rd 2nd 1st 01/AS 3rd 2nd 1st 02/AW 3rd 2nd 1st 03/AW 3rd 2nd 1st Based on Peak Totals (Ranked Highest to Lowest) OWEN EDWARDS TRICS CONSORTIUM
CROSS LAND USE RANKINGS TRICS Location Types 1 Town Centre/Edge of Town Centre 2 Suburban Area 3 Edge of Town 01/AF 3rd 2nd 1st 01/AS 3rd 2nd 1st 02/AW 3rd 1st 2nd 03/AW 2nd 3rd 1st Based on Trips Totals (Ranked Highest to Lowest) OWEN EDWARDS TRICS CONSORTIUM
Different land uses give reasonably similar results Variation in rankings is minimal and strong consistencies are apparent OWEN EDWARDS TRICS CONSORTIUM
Using the four data samples, it is possible to view each location type s variance ranges from the average of all surveys The two tables are based on total peak figures and total trips figures OWEN EDWARDS TRICS CONSORTIUM
TRIP GENERATION RANGES SUMMARY TRICS Location Types 1 Town Centre/Edge of Town Centre 2 Suburban Area 3 Edge of Town Surveys 124 158 178 High -5.9% -1.3% +35.8% Low -18.1% -5.3% +3.5% Average -11.8% -3.2% +13.2% Total Peak figures OWEN EDWARDS TRICS CONSORTIUM
TRIP GENERATION RANGES SUMMARY TRICS Location Types 1 Town Centre/Edge of Town Centre 2 Suburban Area 3 Edge of Town Surveys 124 158 178 High -15.2% +9.7% +7.0% Low -28.6% -28.2% +1.8% Average -21.9% -4.3% +3.7% Total Trips figures OWEN EDWARDS TRICS CONSORTIUM
The average variance tables show Edge of Town surveys have higher than average trip rates Suburban Area surveys tend to have slightly lower than average trip rates Town Centre/Edge of Town Centre have lower than average trip rates OWEN EDWARDS TRICS CONSORTIUM
LOCATION TYPE TRIP RATES VARIATION FINDINGS OWEN EDWARDS TRICS CONSORTIUM
These findings indicate location type variance produces a much more pronounced influence over trip rates than regional variance The regional variance findings showed only minor and inconsistent variations which may have a variety of causes OWEN EDWARDS TRICS CONSORTIUM
Location type results for each of the four land use category variations tended to produce similar results This indicates location type can be one of the more significant factors when it comes to influencing trip rates OWEN EDWARDS TRICS CONSORTIUM
TRIP RATES INFLUENCES OWEN EDWARDS TRICS CONSORTIUM
Instead of deselecting a region, ask why you have made a regional presumption about its trip rates TRICS includes parameters for location type, local populations, public transport pass-bys, car ownership levels, etc OWEN EDWARDS TRICS CONSORTIUM
FURTHER WORK OWEN EDWARDS TRICS CONSORTIUM
Following on from this second piece of research, the findings of both pieces will be combined to create a new Regional and Location Technical Note later this year OWEN EDWARDS TRICS CONSORTIUM


![Town of [Town Name] Real Estate Tax Rates and FY 2024 Budget Summary](/thumb/62211/town-of-town-name-real-estate-tax-rates-and-fy-2024-budget-summary.jpg)