Understanding Classification and Regression Trees
Classification and Regression Trees are powerful tools used in data analysis to predict outcomes based on input variables. They are versatile, easy to interpret, and can handle both categorical and continuous predictors. Different types of trees, such as Regression Trees, Boosted Trees, and Random Forests, offer varying strengths in handling different types of data. These trees help in making decisions based on specific conditions, making them valuable in various fields like GIS analysis, housing price prediction, and environmental assessments.

Download Presentation

Please find below an Image/Link to download the presentation.
The content on the website is provided AS IS for your information and personal use only. It may not be sold, licensed, or shared on other websites without obtaining consent from the author. Download presentation by click this link. If you encounter any issues during the download, it is possible that the publisher has removed the file from their server.
E N D
Presentation Transcript
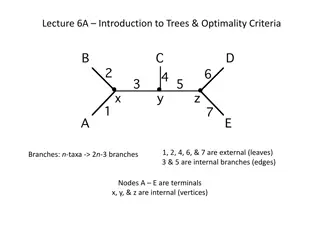
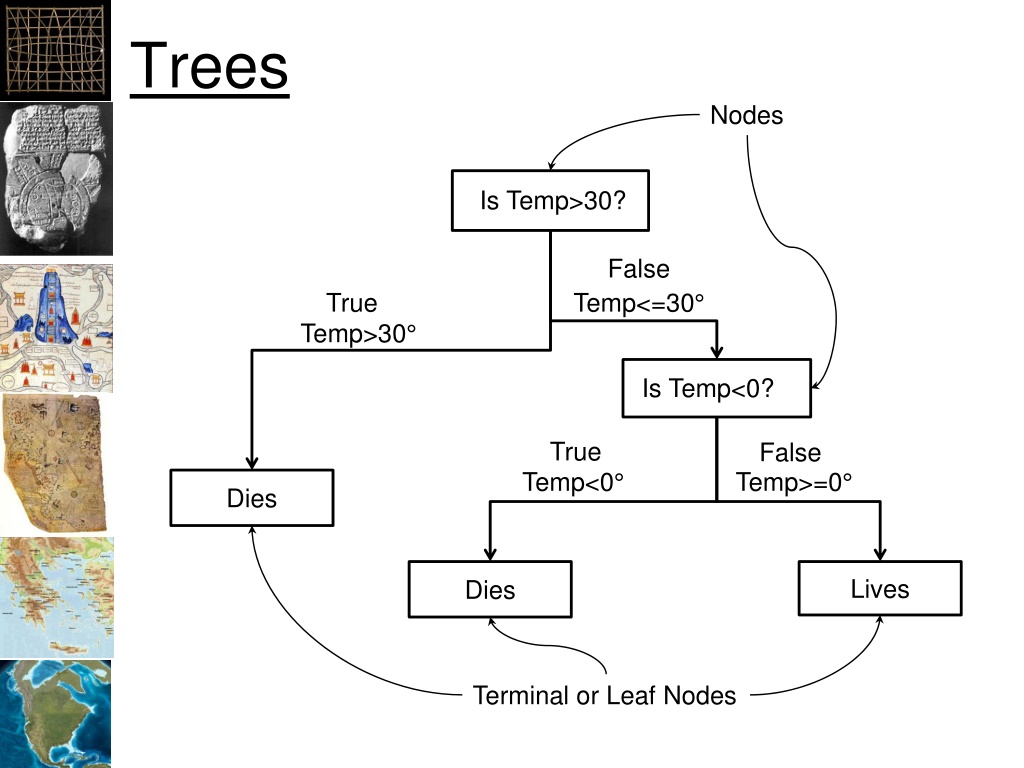
Trees Nodes Is Temp>30? False True Temp<=30 Temp>30 Is Temp<0? True False Temp<0 Temp>=0 Dies Lives Dies namNm15 Terminal or Leaf Nodes
Trees Classification Trees Predicted outcome is a class (cover type) Regression Trees Predicted outcome is a value (percent) Boosted Trees Combines classification and regression trees Random Forests Combines many trees to improve fit namNm15
Classification Trees Reflectance < 0.1 False True Water Reflectance > 0.9 True False Snow or Cloud Ground namNm15
Classification Tree Snow or Cloud Ground Water 0.0 1.0 0.1 0.9 namNm15 Reflectance
Regression Trees Precipitation < 0.5 True False Precipitation < 0.1 Precipitation < 0.9 True False True False Suitability=0.3 Suitability=0.5 Suitability=0.0 Suitability=0.0 namNm15
Regression Trees 1.0 Suitability 0.5 0.3 0.0 0.0 1.0 0.1 0.5 namNm15 Precipitation
Trees Classification and Regression Trees Predictors can be continuous or categorical Easy to interpret and understand Robust Easy to validate Statistical methods well understood Can still make really complex trees that over fit the data! namNm15
Regression Trees in GIS namNm15 Geospatial and regression tree analysis to map groundwater depth for manual well drilling suitability in the Zinder region of Niger
CA Housing Prices namNm15
CA Housing Prices namNm15
Building Trees Goals: Find the tree with the least number of nodes (branches) that best represents the phenomenon Approach: Minimize the deviance that the samples have from the model namNm15
R squared With continuous response, we can use sum of squares as the deviance: ???????????= (?? ??)2 Where: ?? = observed values ?? = predicted values namNm15
CART Evaluation Model is fit to the data using Maximum Likelihood This is the same as minimizing the deviance of the predicted model values from the sample data Minimizing the sum of the differences between the predicted and sampled values You will also see deviance explained which is the amount of deviance explained by a model or portion of it namNm15
Regression Trees in GIS Length of branch indicates amount of deviance explained namNm15 Geospatial and regression tree analysis to map groundwater depth for manual well drilling suitability in the Zinder region of Niger
Regression Trees namNm15 Analysis of Object Oriented Software, Science Direct
Additional Resources An Introduction to Categorical Data Analysis By ALAN AGRESTI Page 85 R Documentation: http://cran.r- project.org/web/packages/tree/tree.pdf namNm15