Illustrative Cohort Flowcharts and Analysis in Acid Suppression Therapy Studies
Detailed flowcharts of primary and secondary cohorts in studies related to acid suppression therapy, along with figures estimating the impact of various factors on outcomes like risk of death. The visuals depict the cohort selection process, exposure durations, confounding factors, and external adjustments made for accurate analysis.

Download Presentation

Please find below an Image/Link to download the presentation.
The content on the website is provided AS IS for your information and personal use only. It may not be sold, licensed, or shared on other websites without obtaining consent from the author. Download presentation by click this link. If you encounter any issues during the download, it is possible that the publisher has removed the file from their server.
E N D
Presentation Transcript
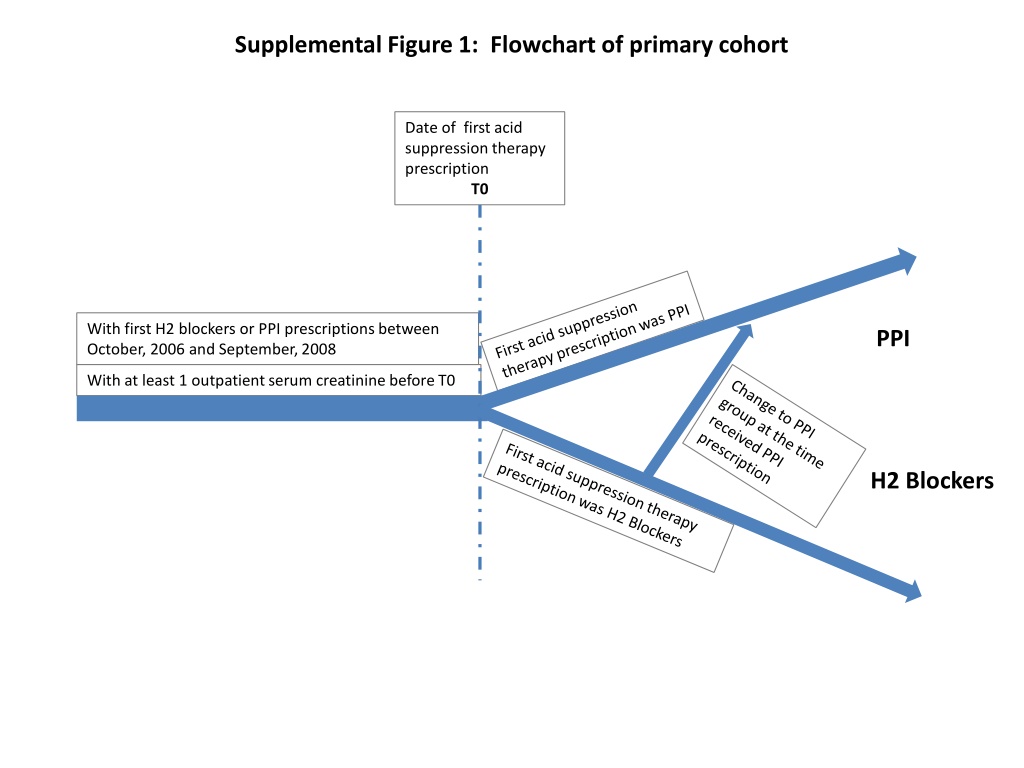
Supplemental Figure 1: Flowchart of primary cohort Date of first acid suppression therapy prescription T0 With first H2 blockers or PPI prescriptions between October, 2006 and September, 2008 PPI With at least 1 outpatient serum creatinine before T0 H2 Blockers
Supplemental Figure 2a: Flowchart of secondary cohort PPI vs no PPI October 01, 2006 T0 Change to PPI group at the time received PPI prescription PPI With no PPI prescription before October 2006 With at least 1 outpatient serum creatinine before T0 No PPI
Supplemental Figure 2b: Flowchart of secondary cohort PPI vs no PPI no H2 blockers October 01, 2006 T0 Change to PPI group at the time received PPI prescription PPI With no PPI prescription before October 2006 No acid suppression therapy With at least 1 outpatient serum creatinine before T0 Excluded from cohort if received H2 blockers prescription
Supplemental Figure 3: Duration of PPI exposure and risk of death among new PPI users in an older (less contemporary) sensitivity cohort (n=101,109)
Supplemental Figure 4: Estimation of the impact of uncontrolled confounder using the rule-out approach 10.00 AHR=1.25 8.00 OR for confounder and PPI 6.00 4.00 2.00 0.00 0.00 2.00 4.00 6.00 8.00 10.00 HR for confounder and death
Supplemental Figure 5: External adjustment to estimate the impact of 3 unmeasured confounders 30 External adjustment 25 Obese 20 Bias of HR for PPI to death in % 15 Smoking Assuming HR=1.30 Bias=3.96% 10 Assuming HR=2.80, Bias=4.23 % anticoagulants, antiplatelet agents, and non-streroidal anti-inflammatory drugs 5 0 Assuming HR=1.30, Bias=1.47 % -5 1 1.5 2 2.5 3 3.5 4 4.5 HR for confounder to death