Overview of National Deaf-Blind Child Count
The National Deaf-Blind Child Count, led by Robbin Bull, provides a comprehensive historical review and collects demographics to assess state-level needs for children and youth with deaf-blindness. The initiative aims to ensure high-quality services, research, and personnel preparation for individuals with deaf-blindness. Key questions addressed include identifying the population, understanding disabilities, service locations, and training needs.

Download Presentation

Please find below an Image/Link to download the presentation.
The content on the website is provided AS IS for your information and personal use only. It may not be sold, licensed, or shared on other websites without obtaining consent from the author. Download presentation by click this link. If you encounter any issues during the download, it is possible that the publisher has removed the file from their server.
E N D
Presentation Transcript
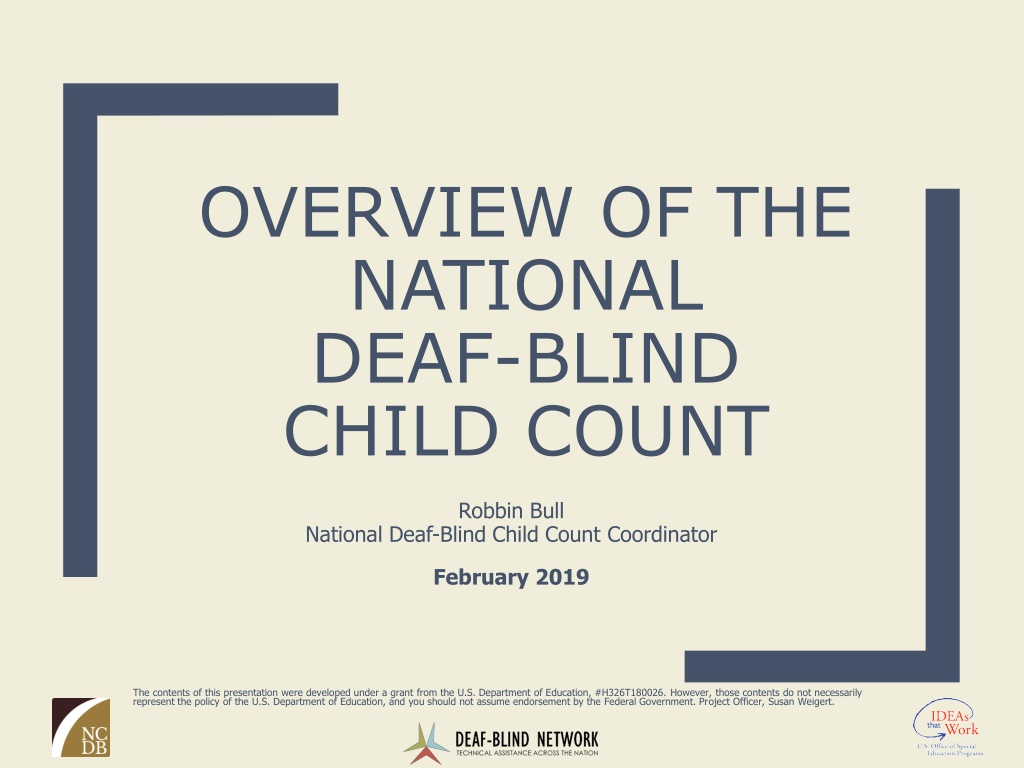
OVERVIEW OF THE NATIONAL DEAF-BLIND CHILD COUNT Robbin Bull National Deaf-Blind Child Count Coordinator February 2019 The contents of this presentation were developed under a grant from the U.S. Department of Education, #H326T180026. However, those contents do not necessarily represent the policy of the U.S. Department of Education, and you should not assume endorsement by the Federal Government. Project Officer, Susan Weigert.
HISTORICAL REVIEW
History of the Annual Child Count The annual National Child Count of Children and Youth who are Deaf-Blind (Birth 21) has been conducted since 1986. It represents a snapshot count on December 1st of each year to supplement OSEP s federal Child Count, which includes children as deaf-blind when deaf- blindness represents their only disability. It is the first, and longest running, registry and knowledge base for children who are deaf-blind.
Comprehensive set of demographics, such as.. Age distribution, ethnicity, and primary etiology Documented vision and hearing loss Primary IDEA classification categories and additional disabilities IDEA special education status IDEA placement and living settings
Why do we collect this information? To assure current and accurate state-level needs assessment data is available and used in the design and delivery of TA and to inform current research needs and personnel preparation. So that all children who are deaf-blind are getting the highest quality services available to meet their individual needs.
Questions we seek to answer Who are the children and youth with deaf-blindness throughout the country and how many are there? What is the relationship of the Deaf-Blind Child Count (DBCC) to the IDEA Part B and Part C Annual Child Counts? What is the extent of the vision and hearing losses of those reported on the DBCC, and what additional disabilities do they manifest? Where are those reported receiving services and what types of supports are they receiving, and how does this impact technical assistance and training needs? Where are they living and how does this impact technical assistance and training needs?
CENSUS OVER TIME
Snapshot in time Since 2003 we include only those who are in SpEd and eligible to receive SDBP services on December 1 each year First table only shows those eligible to receive state deaf-blind project services on December 1, regardless of whether they are in Part C or Part B.
Relationship to Part B and Part C 2003 - Part B and C exiting data elements included (created snapshot count) 2006/2007 - Realignment of data elements with IDEA, section 618 data reporting requirements and changes in documentation procedures consistent with IDEA classification and reclassification regulatory changes 2007 IDEA definition of deaf-blindness adopted as consistent definition for DBCC 2009 - Realignment of Part C codes with IDEA, section 618 data reporting requirements 2010 Race/Ethnicity updated to be consistent with new 618 requirements in IDEA 2004
Definition of deaf- blindness IDEA 2004 definition of deaf-blindness states that: Deaf blindness means concomitant hearing and vision impairments, the combination of which causes such severe communication and other developmental and educational needs that they cannot be accommodated in special education programs solely for children with deafness or children with blindness For infants and toddlers receiving Part C early intervention services, deaf-blindness is defined as: Concomitant hearing and vision impairments or delays, the combination of which causes such severe communication and other developmental and intervention needs that specialized early intervention services are needed. * *Defined by NTAC/SDBP workgroup in 2006
National totals, 10 years National Deaf-Blind Child Count Totals: 2007 - 2017 10,174 10,000 9,827 9,635 9,574 9,525 9,454 9,387 9,384 9,320 9,200 2007 2008 2009 2010 2011 2012 2013 2014 2015 2016 2017
Age groups, 7 years AGE GROUPS: 2010 - 2017 0-2 (%) 3-5 (%) 6-11 (%) 12-17 (%) 18-21 (%) Over 21 (%) 33.4% 33.1% 33.0% 32.9% 32.7% 32.6% 32.5% 32.1% 32.1% 32.0% 31.5% 31.2% 31.0% 30.8% 30.7% 29.7% 18.0% 17.4% 16.9% 16.2% 15.6% 15.4% 15.3% 15.2% 13.9% 13.6% 13.4% 12.7% 12.4% 12.3% 12.2% 12.1% 6.4% 6.2% 6.1% 6.0% 6.0% 5.9% 5.8% 5.8% 1.2% 1.0% 1.0% 0.8% 0.7% 0.7% 0.3% 0.3% 2010 2011 2012 2013 2014 2015 2016 2017
Documented FUNCTIONAL vision loss and hearing loss A Functional Vision Assessment is defined as a non- clinical assessment, carried out by a trained vision specialist using commonly accepted assessment tools, checklists and measures for making educated judgments about the functional use of vision. A Functional Hearing Assessment is defined as a non-clinical assessment carried out by a trained hearing specialist using commonly accepted assessment tools, checklists and measures for making educated judgments about the functional use of hearing.
Documented Vision loss, 2017 Vision Loss Documented Functional Vision Loss 22% Low Vision 32% Further Testing Needed (1 year only) 7% Diagnosed Progressive Vision Loss 4% Totally Blind 5% Legally Blind 24% Light Perception Only 6%
Documented Hearing Loss, 2017 Hearing Loss Documented Functional Hearing Loss 13% Mild 13% Further Testing Needed (1 year only) 9% Moderate 19% Diagnosed Progressive Loss 1% Profound 20% Moderately Severe 15% Severe 10%
Vision loss by hearing loss, 2017 National: 2017 Documented Vision Loss by Documented Hearing Loss 800 700 600 500 Count 400 300 200 100 0 Hearing Loss: Mild Hearing Loss: Moderate Hearing Loss: Moderately Severe Hearing Loss: Severe Hearing Loss: Profound Hearing Loss: Diagnosed Progressive Loss Hearing Loss: Further Testing Needed (1 year only) Documented Functional Hearing Loss Low Vision Totally Blind Documented Functional Vision Loss Legally Blind Diagnosed Progressive Vision Loss Light Perception Only Further Testing Needed (1 year only)
Race/Ethnicity, 2017 Asian 4% American Indian or Alaska Native 2% Two or more races 3% Black or African American 15% Native Hawaiin/Pacific Islander 1% Hispanic/Latino 20% White 55% Race/Ethnicity
Top Etiologies, 2017 Etiology Count Hereditary Syndromes/ Disorders 2552 Complication of Prematurity 1047 CHARGE Syndrome 933 Pre-Natal Congenital Complications 678 Post-Natal Non-Congenital 670 Usher Syndrome (I,II,III) 329 Down syndrome 315 Cytomegalovirus (CMV) 292 Microcephaly 214 Hydrocephaly 206 Asphyxia 194 Severe Head Injury 159 Stickler syndrome 137 Meningitis 137 Dandy Walker syndrome 115 Goldenhar syndrome 101
Other Disabilities, 2017 Additional Disabilities 80 74 65 70 59 60 51 50 Percent 40 30 19 20 10 10 0
Early Childhood and School Age Ed Setting, 2017 Educational Setting (3- 21) 35.0 32.8 30.0 25.0 Percente 20.0 15.7 15.0 12.4 10.0 7.9 5.5 5.1 5.0 2.1 2.1 2.0 1.8 1.3 1.0 0.8 0.4 0.4 0.0
Intervener Services, 2017 Intervener Services 80.0 70.6 70.0 60.0 50.0 Percent 40.0 30.0 22.3 20.0 7.1 10.0 0.0 No Yes Unknown/Missing
Living Setting, 2017 Living Setting 100.0 88.8 90.0 80.0 70.0 60.0 Percent 50.0 40.0 30.0 20.0 10.0 4.1 1.8 1.2 0.8 0.5 0.3 0.3 0.2 0.0 0.0 Home: Parents Home: Extended Family Home: Foster Parents State Private Residential Facility Group Home (less than 6 residents) Group Home (6 or more residents) Apartment (w/ non- family person(s)) Pediatric Nursing Home Other Residential Facility