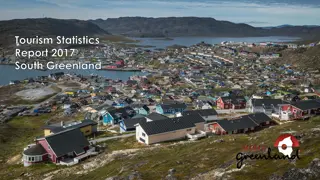
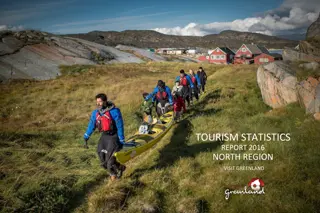
Tourism Statistics Report 2016 for Kujalleq/South Region in Greenland
Visit Greenland initiated regional tourism reporting in Q1 of 2015, focusing on flight passengers, overnight stays, and cruises. The report highlights challenges in accurately interpreting data, particularly with regards to tourist numbers. The focus has shifted to regional collaboration to gain insight into tourism revenue and overnight stays, starting with the Arctic Circle region. Quarterly reports are now consolidated into one annual national report, with supplementary updates throughout the year. The report delves into the trends of flight passengers out of Narsarsuaq from 2008 to 2016. Passenger numbers saw variations over the years, influenced by operational changes and external factors. A growth in international passengers was evident from 2015 to 2016.

Download Presentation

Please find below an Image/Link to download the presentation.
The content on the website is provided AS IS for your information and personal use only. It may not be sold, licensed, or shared on other websites without obtaining consent from the author.If you encounter any issues during the download, it is possible that the publisher has removed the file from their server.
You are allowed to download the files provided on this website for personal or commercial use, subject to the condition that they are used lawfully. All files are the property of their respective owners.
The content on the website is provided AS IS for your information and personal use only. It may not be sold, licensed, or shared on other websites without obtaining consent from the author.
E N D
Presentation Transcript
TOURISM STATISTICS REPORT 2016 KUJALLEQ/SOUTH REGION VISIT GREENLAND
INTRODUCTION In Q1 of 2015 Visit Greenland made its first regional tourism report based on data on flight passengers, overnight stays in accommodations as well as cruises. Since then, VG has been working on a deeper level in the data and, among other things, has learned that some data can easily be over- interpreted. Data for the number of tourists directly by plane from Greenland, via regional airports, does not necessarily say so much about the number of tourists who have visited the region, as the vast majority of tourists from Greenland still travel via Kangerlussuaq. Data from Greenland s airport authority show that 85-90% of all passengers (incl. Greenlandic citizens) are travelling out of Ilulissat, Nuuk and the other larger cities via Kangerlussuaq. In order words only 10-15 % of passengers travel out of the country directly via the Iceland-routes from the cities. Tourists comprised a total of 64 % of all flight passengers in 2016. This report will focus more closely on the regional overnight stay statistics even though in its current form it does not cover all accommodations. On the other hand, Visit Greenland has initiated an intensive cooperation with the Arctic Circle region as the first region to arrive at a more accurate figure on the two parameters: Total tourism turnover and number of tourist stays (initially focusing on Kangerlussuaq). With the Arctic Circle collaboration as a pilot , Visit Greenland intends to roll out region specific collaborations in order to gain more knowledge of tourism generated revenue and overnight stays. Initially Visit Greenland intended to publish a tourism report quarterly. But our intensive work with tourism statistics over the last two years, have shown that the number of tourists in each quarter, except Q3, is so small that it does not provide valid useable data. Greenland still has so relatively few tourists that is risky to interpret small fluctuations as they will appear unnaturally big as a percentage the less the number is. Therefore, going forward only one big national tourism report on the previous year will be produced. In Q1 this will be followed by regional reports such as this, but mainly as an addition to the national report as the most important results can be found there. Furthermore minor updates will be issued during the year via press releases and newsletters serving as a supplement to the annual main reports.
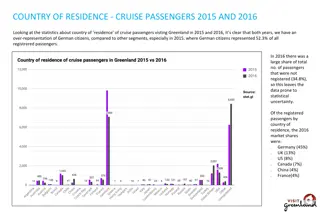
INT. FLIGHT PASSENGERS OUT OF NARSARSUAQ 2008 - 2016 In 2008 Narsarsuaq airport had 12,219 international passengers. Since then numbers have steadily declined up to 2013. It s a similar development we canobserve on a national level, but the curve is a bit steeper in Narsarsuaq. Air Greenland operated Copenhagen-Narsarsuaq with their Boeing 757 untilthe end of 2008, but then it was sold. Instead the route has since been operated by a chartered Boeing 727, with a lower capacity. At the same timeall-year operation was ceased, and the route has only been operated during the summer. International passengers have had to fly via Kangerlussuaqor Nuuk during off-summer months since then, and the consequences of this is quite clear in the graph below in the years 2008-2013. During the years 2011 through 2016 the no.of international passengers stabilized aroundroughly 5,000 pax/year, and since 2013there has been a minor growth tendency. Since July 2014 data on country of residence has been available in the passenger data on selected segments (DK,DE, FR, IS, NO, SE, IT, ES, GB, RU, US, CA, CN,JP, TW, Other Europe and Other country),and if you compare the periods Q3-4 2014with Q3-4 2015, there was a growth for thetourist segment (as a whole) of 0,9%. From2015 to 2016 there was a growth of 14,5%for the tourist segment as a whole. Source: stat.gl
INT. FLIGHT PASSENGERS OUT OF NARSARSUAQ 2016 VS 2015 There are only international flights in and out of Narsarsuaq in June, July and September. In 2016 a total of 5,315 passengers departedfrom here, so the data is limited. With a number of less than 1,000 passengers per country of residence the statistical uncertaintyis so big that the percentage change is to be taken with reservations. Thus those figures are gray in the figure below. South Greenland has experienced a positive growth of 14.5 % in the number of tourists from 2015. The largest market are Denmark and Spain. Though relatively small in numbers we also see growth in regards to France, USA, Germany and Great Britain. The largest percentwise growth of a staggering 974% can be seen for China, but this clearly highlights the problem of inflated growth rates as the difference in the number of persons is a change from 1 person i 2015 to 13 persons in 2016. As to the numberof tourists travelling by plane to South Greenland via Kangerlussuaq during the other months of the year, we currentlyhave no information, as these data from Air Greenland are not available.
NO. OF OVERNIGHT STAYS IN ACCOMMODATIONS IN SOUTH REGION According to data from Statistics Greenland a positive growth of 17.8% can be observed in the number of overnightstays in the region. Th growth can primarily be attributed to a growth of 22.6% in the numberof overnightstays by residents while a small negative growth of -0.2% can be seen in the number of foreign overnightstays . The increased numberof tourists arriving in the region via airplane will thus either have to seek private accommodation, accommodations in places that do not report registrations to Statistics Greenland or they are in transit out of the region on coast- or cruise ships. We know of groups of smaller accommodations that do not report registrations to Statistics Greenland and therefore they do not feature in these data. Statistics Greenland and Visit Greenland intendto collaborate with the regions in order to get more accommodations to register and report data for the overnight stay statistics. The goal is to ensure a uniform and valid set of data on the numberof overnightstays in all regions.
NO. OF GUESTS IN ACCOMMODATIONS IN SOUTH REGION Accommodations register both the numberof overnightstays ans the number of guests. This makes it possible to study the development in the average duration of stays and compare the development in the number of guests with the development in e.g. the number of flight passengers. Accommodations in the region have registrered9.7 % more guests than in 2015. As with the number of overnightstays this growth is attributed to an increase of 16.1 % in the number of residents. In total there is a decrease of -11,8 % in the number of tourists. The percentwisedecrease in the number of touristsis bigger than the decrease in the number of tourist overnight stays, which means the average tourist in 2016 stayed more nights per touristin registered accommodationsthan in 2015. As the number of sold touristovernightstaysis practically unchanged in comparisonto 2015 the decreasing number of foreign touristsshould not necessarily be interpreted as a negative sign. Small discrepanciesin the data show that they are not complete.
OCCUPANCY RATE IN ACCOMMODATIONS IN SOUTH REGION The occupancy rate is a measure of how big a part of the total numberof available rooms are in use on average during a period of time. The diagram below displays the growth in the number of overnight stays as a significant improvement of the occupancy rates especially in July and August, but in June as well. 2015 saw a generally low occupancy of 21 % throughout the year with a slight fluctuation in the summer months. 2016 on the other hand was a good summer high season and saw an improved occupancy, thoughit remains relativelylow with an average of 25 % seen across the year. As can be seen in the previous pages the positive delvelopment duringhigh season is carried primarily by the home market. Thus there is a need for a focused effort to attract more overnight tourists to the region. Tourism development rarely happens evenly throughoutthe year, but usually begins aroundthe high season when the destination holds a special power position. To ensure a better occupancy and profitability in the tourism infrastructure, work must be done to furtherstrengthen the high season and initiate growth in the shoulder seasons. Alongside sheep holders, the Kujalleq Municipality and Icelandic operators, Visit Greenland has worked with the development of farm tourism. South Greenland has a uniqueopportunity to develop this special product, and we know from Iceland that the demand is there. Furthermore several operators in the area are launching wilderness camps using tents and cabins. They make up new types of accommodations that extend the palette of options for overnight stays and seem to increase the market.
CRUISE TOURISM IN SOUTH REGION 2016 saw a 3.2 % decrease in the number of cruise guests in Greenland compared to 2015. However the ships called on more ports than in 2015, so in actuality there has been an increase in the numberof passengers at the destinations in Greenland in 2016 compared to 2015. In other words each ship has had more calls than the year before. From the cruise-surveyin 2015, we know that 98 % of the passengers went ashore at least once during their cruise. Therefore there were probablymore guests ashore in 2016 than in 2015. From a destination perspective this is even more positive as more guests ashore in several destinations increases the probabilityof an increased turnoveron tourism related products, souvenirs and food or snacks. Kangerlussuaq is the biggest exchange airport for cruise passengers either arriving or leaving the country by airplane. However, an increasing number of cruise passengers exchange in Nuuk, Ilulissat, Narsarsuaq and Aasiaat. If/when a new airport in Qaqortoq is realized it will increase the opportunityfor cruise passenger exchange in the city. Measured by the number of passengers Kujalleq is the second largest cruise region in Greenland with a total of 22,771 guests arriving at ports in the region in 2016. 2015 saw 21,434 guests on ships in the region, leaving 2016 with a growth of 6.2 %. In 2015 the Greenland self- government decreased the port call taxes for the ships that now pay per gross tonnage instead of per passenger. The previously high passenger taxes are thus no longer an economic barrier when planning port calls in Greenland.
CRUISE TOURISM PAX SIZE AND NUMBER OF PORT CALLS We divide the cruise ships in 4 categories according to size: Small, primarily expedition ships with 1-250 passengers., smaller ships with 251-500 passengers, midsize ships with 501-1,200 passengers and lastly the big resort ships carrying more than 1,200 passengers. The chart below shows the numberof port calls per ship type in 2015 and 2016. The chart shows a growth in the number of port calls for all types, except for ships carrying 251-500 passengers that saw no change. The region differs from the other regions in the relatively large number of big resort ships with a high passenger volume and thus good opportunities for selling souvenirs and group products. For local operators offeringand developing products aimed at the cruise ships these tendencies are worth following closely as there is a difference in what products are sought after by the passengers on the differenttypes of ships. At a national level there is a significant increase in the number of cruises among the small expedition ships. I South Greenland the same trend can be seen thoughnot as significantly. On the other hand, because of its location, the region has a strong position when it comes to the larger transnational cruises with large and midsize ships as their port calls in South Greenland are often the first and only calls in Greenland. For the operators of the region this geographic advantage offers a unique opportunity to develop souvenir sales and products aimed specifically at the passengers on the large ships.
CRUISE TOURISM PAX SIZE AND NUMBER OF CRUISES It is relevant to examine what ship sizes have had what number of cruises nationally in Greenland over the last years. A cruise consists of anywhere between 1-5 port calls per ship typically depending on the type of ship. Over the past 8 years the most significant developmentnationally has been the growth in the number of the small, so-called expedition ships with a passenger number of less than 250 pax. Whereas the other pax categories saw a relatively stable numberof cruises from year to year, a marked growth since 2011 can be observed when it comes to the expedition ships. Even thoughthe numberof cruise tourists arriving in Greenland decreased by 3.2 % in 2016 compared to 2015, there is still a rise in the number of cruises. In other words, more destinations were paid a visit. Expedition ships are a good match for many Greenlandic destinations as they are generally smaller and carry more active and dedicated passengers than on the big resort ships. Fewer and more destination oriented passengers offer the possibility of offering products and souvenirs to a larger share of guests thus increasing the turnoverlocally. It is difficultto say if the growth in the 501- 1,200 pax and 1,200+ pax categories are representing a stable trend.
FINAL THOUGHTS An Increase in Airplane and Ship Tourists South Greenland saw a increase of 14.5 % in the number of tourists by airplane. It is remarkable that the number of Danish tourists arriving via airplane grew by 25.6 % thus making them the largest group travelling by plane, even bigger than resident travelers. Spain is the second largest market for airplane tourists with a growth of approximately 10 %, though there must be reservations for the growth rate as the total number of Spanish tourists was less than 1,000 in 2016. The region welcomed 6.2 % more cruise passengers in the cities of the region in 2016 than in 2015. South Greenland stands out with a growth on the big cruise ships with 1,200+ passengers. Growth in the Number of Overnight Stays, but not by Tourists The region has experienced a significant growth in the number of overnightstays of 17.8 %, the number of hotel guests of 9.7 % and an improvement of almost 5 % the average occupancy rate. This trend is especially evident in the summer months which now show a clear high season in July and August. However, this growth is not due to tourists. The numberof tourist overnight stays is unchangedand a decrease in the number of guests from other countries than Greenland has been registered. On the other hand, there was 22.6 % growth in the number of overnight stays of residents and 16.1 % more resident guests. Thus, the increased number of tourists arriving in the region must either stay in accommodations that do not submit registrations to Statistics Greenland, in the open, or be in transit out of the region with, for example, coastal or cruise ships. Potential In 2016 the region developed the brand Explorers by Nature as a narative framework that in the coming years will support the marketing of the experiences of South Greenland differentiate the region from other destinations in Greenland. Similarly, collaboration with Icelandic operators on the development of farm tourism is an opportunity to attract new segments. The positive development in the Danish and Spanish markets can also be explored further thus strengthening the positive development especially in the high season and in the longer run the shoulder seasons as well. The reduced taxes on specifically the larger cruise ships and the geographic position of the region represent a potential for an increased Transatlantic cruise tourism in the years to come. Compiled by market analysisconsultant, Mads Lumholt, March 2017