HUD Healthcare Programs FY13 Year-End Report
The HUD Healthcare Programs FY13 Year-End Report highlights the successful management of Section 232 and Section 242 applications, with a focus on proactive asset management, commitment processing, and new regulations. The report also discusses anticipated transaction volumes for FY14, indicating potential growth and expanded program utilization. Lender Training initiatives and LEAN streamlining efforts are emphasized as key strategies moving forward.
Download Presentation

Please find below an Image/Link to download the presentation.
The content on the website is provided AS IS for your information and personal use only. It may not be sold, licensed, or shared on other websites without obtaining consent from the author. Download presentation by click this link. If you encounter any issues during the download, it is possible that the publisher has removed the file from their server.
E N D
Presentation Transcript
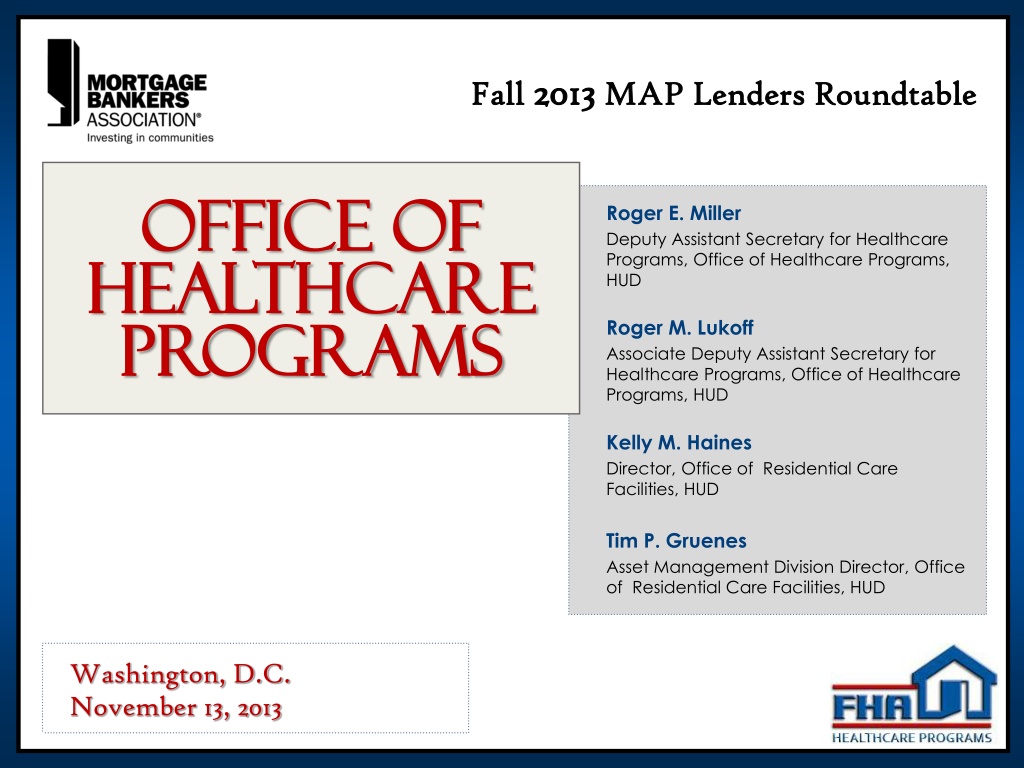
Fall Fall 2013 2013 MAP Lenders Roundtable MAP Lenders Roundtable Office of Office of Healthcare Healthcare Programs Programs Roger E. Miller Deputy Assistant Secretary for Healthcare Programs, Office of Healthcare Programs, HUD Roger M. Lukoff Associate Deputy Assistant Secretary for Healthcare Programs, Office of Healthcare Programs, HUD Kelly M. Haines Director, Office of Residential Care Facilities, HUD Tim P. Gruenes Asset Management Division Director, Office of Residential Care Facilities, HUD Washington, D.C. November 13, 2013 1
FY13 Year-End Report Section 232 Maintained a negative credit subsidy and very low claim rate in FY13 through proactive asset management Processed a record $6.4 billion in commitments for 806 projects, and completed 766 closings, despite commitment authority constraints. Average processing time for underwriting refinancing deals was 66days. Reduced queues. Section 242 Maintained a negative credit subsidy with zero claims in FY13 through proactive asset management Processed $895 million in commitments for 11 hospitals, with 1 223(f) and 7 a(7) refinancing deals. Median processing time in FY13 for Section 242 applications was 76 days. Completed Section 232 Handbook for clearance processing (currently in progress) and rolled out new Section 232 documents. Continued LEAN streamlining efforts and answered 925 LeanThinking questions. Implemented the new Section 223(f) Regulation and published the new Section 242 Handbook. Held Lender Training in July 2013, as well as several LEAN events to encourage standardization and streamlining of 242 processes. 2
Year-End Production Statistics Section 232 Type of Application Applications Received Commitments Issued count $ billions FY13 456 399 34 FY13 250 522 34 FY13 $2.1 $3.9 $0.4 FY11 347 302 59 FY12 458 221 35 FY11 231 210 32 FY12 404 354 25 FY11 $1.8 $1.6 $0.3 FY12 $3.0 $2.8 $0.3 223f 223a7 Other 889 806 $6.4B Grand Total 708 714 473 783 $3.7B $6.0B Section 242 Commitments Issued count Type of Application $ millions FY13 FY13 FY11 6 1 FY12 3 1 2 FY11 $354 $15 FY12 $167 $55 $24 242 241 223a7 223f Grand Total 3 7 1 $621 $253 $20 $894M 1 $29 11 8 6 $398M $246M 3
Anticipated 242 Volumes in FY14 Expect to see lower volumes of 223(a)7 transactions Given recent interest rates and number of hospitals that have not already refinanced Expect overall larger volumes than FY13 Wider use of 223(f) program following Summer 2013 Lender Training Stronger direct marketing efforts with HFMA and national banks Efforts to streamline the application process through LEAN Plans for Summer 2014 Lender Training 4
2013 Lender Training Recap One-day training in July 2013 held at HUD HQ and online Workshop focused principally on 223(f) application process and guidance Nearly 50 lenders attended in person and over 85 joined virtually More than 60% of the participants did not attend prior lender trainings Lender Training Videos and content available online at www.fha.gov direct link under Healthcare Programs 5
Status of 242/223(f) Program Expect FY14 application volumes to exceed FY13 Been engaged in discussions with several hospitals and lenders regarding 223(f) opportunities Currently have at least 4 transactions nearing pre-application, and 1 transaction has been invited to apply Encourage lenders and hospitals to engage HUD early and often on any potential transactions 6
Status of 242 Handbook HUD has invested substantial time and effort to analyze questions raised by the Committee on Healthcare Finance Examined procedures, structures, handbook language guidance, and reviewed numerous details of how we operate compared to 232 and other HUD programs Handbook revisions currently in clearance processing Once Mortgagee Letter is posted we will release HUD s response to industry 7
What a Year for the 232 Program Strong Year Ended-806 firm commitments issued for $6.4B, compared to 792 firm commitments in FY 2012. New Documents rolled out Creation of 232 Handbook (in clearance) ICA task force Commitment Authority Constraints Sequestration Days Shutdown 925 LeanThinking questions 9
Production Activity FYE 2013 Office of Healthcare Programs- ORCF Year End Production Statistics Firm Commitments Issued Total Commitment Dollars Count % of Total Average Mortgage Amount Application Type Dollars % of Total Total Units Count 223a7 $ 3,903,174,931 60.8% 522 65% $ 7,477,347 59,679 223f $ 2,138,382,900 33.3% 251 31% $ 8,519,454 30,660 NC & Other $ 376,427,700 5.9% 33 4% $ 11,406,900 4,062 Totals $ 6,417,985,531 100.0% 806 100% $ 7,962,761 94,401 *Note- 46 carried over due to lack of commitment authority totaling 278m 11
Queue As of November 1, 2013 APPLICATIONS CURRENTLY IN UNDERWRITING REVIEW 139 TOTAL APPLICATIONS IN QUEUE (NOT YET ASSIGNED) 223a7 Queue 223f Regular Queue 138 14 107 223f Portfolio Queue 232 Other Queue New Construction Sub-Rehab 241a Blended Rate Fire Safety 0 17 9 1 7 0 0 Note- Contractor assigned 15 per week 12
Section 232 Program Demand Section 232 Applications Received FY 2013 120 100 80 Number of Apps 60 40 20 0 Oct-12 Nov-12 Dec-12 Jan-13 Feb-13 Mar-13 Apr-13 May-13 Jun-13 Jul-13 Aug-13 Sep-13 Oct-13 Nov-13* -20 232 New Constr/Sub-Rehab/Blended Rate/241a 223f Refinance New FHA Loan *As of Nov. 4, 2013 223a7 Refinance Existing FHA Loan TOTAL Linear (223f Refinance New FHA Loan) Linear (223a7 Refinance Existing FHA Loan) 14
Loan Committee Mechanics Held 3 Days a week Tuesday/Wednesday/Thursday 12 slots for each Loan Committee Wednesday is primarily A7s, but also can include discussions/approvals on Workouts Ensures Consistency across the Program Division Directors, Credit Risk Officer, Lender Relations Liaison, along with others (ORM, OGC) 15
Frequent Issues from Loan Committee Make sure UW NOI is less than or equal to T12 Problems occur when underwritten NOI is prospective Loan Committee Discussions: UW NOI > T12 and 2012 When annualized NOI is used to support UW NOI Big delta between NOI for value and NOI for DSCR Normalized NOI for any expense items other than management fee, replacement reserves, property taxes 16
Appraisers 806 firm commitments fiscal year 2013 $6.4 billion fiscal year 2013 400 appraisals to review each year Developed expense library based on prior HUD appraisal reviews Decision Circuit to streamline reviews 17
Appraiser Decision Circuit Decision Circuit used by Appraisal team to conduct a preliminary risk assessment Uses red flags to identify areas of concern and then builds a custom appraisal review form, asking only the questions we want the HUD reviewer to focus on. Flags show up for items such as: Forecasted NOI not supported by history Consecutive declines in NOI Very low occupancies or consecutive declines in occupancy Very large loans Departure from historic census mix favoring higher paying sources. Very high Medicare census, and No in-state sales data 18
Appraisal Issues that can lead to Problems Failure to account for new competition in the pipeline when forecasting demand, occupancy, payor mix, rents and cap rates. Departing from the historic NOI experienced at the property. Forecasting low expenses and very high rents. Proposing a configuration never attempted in the market. 19
Use of Prospective NOI in Underwriting Appropriate Mitigation Combination of: Reduce Mortgage Underlying Reasons for Using Prospective NOI Debt Service Reserve - to be held for 12 consecutive months until underwritten NOI is achieved Reserve amounts equal to 3-12 months of debt service Risk to HUD Degree of Aggressiveness Loan to Value Accept As-Is Reject Application 20
Closing Team Updates ORCF s Closing Team is keeping the conveyor belt of closings moving! In FY 2013 we had 766 closings, compared to 706 in FY 2012, 415 in FY 2011, and 309 in FY 2010 Collapsed 1 part legal review is in motion! Starting with deals with firms after July 12, 2013 (same date as new 232 docs), there is only a one-part legal review for most projects after issuance of firms (exceptions include Master Lease, A/R Financing, new waivers, etc.) Please Remember: for a HUD Closer assignment (and any other closing related issues) email ORCFCloser@hud.gov 22
Closing Table Closing Docs Partnership & Collaboration Please Remember: Complete, clean, and accurate closing packages get reviewed and closed quicker All special conditions must be met and properly documented prior to closing Responsiveness to HUD Closer and HUD Attorney and fast turnaround is KEY 23
Program Updates and Initiatives Handbook Status ICA- Final ICA under review, once approved we will work to make option available before new ICA published All new documents must be used for firm commitments issued and Asset Mgmt submissions after July 12, 2013 Document Implementation Matrix coming in email blast which spells out other transactions that would trigger the use of some or all of the new documents Email leanthinking@hud.gov with questions 24
SPRINKLER COMPLIANCE PRODUCTION/ASSET MANAGEMENT 25
Sprinkler Compliance Automatic Sprinkler Required in All Nursing Homes: All nursing homes must be fully sprinklered as of August 13, 2013 in order to participate in Medicare or Medicaid. Five-Year Phase-In to August 13, 2013: The sprinkler requirement was published on August 13, 2008 in a final rule entitled Medicare and Medicaid Programs: Fire Safety Requirements for Long Term Care Facilities, Automatic Sprinkler Systems. The regulation provided a five- year advance timeframe to achieve full sprinkler status by August 13, 2013. Survey Process: While CMS is not requiring any special surveys focused on the sprinkler requirement, a life-safety code (LSC) inspection is part of each facility s recertification survey. As these surveys occur during the year, facilities that are not fully sprinklered on or after August 13, 2013 will be cited for a deficiency. No Extensions: CMS does not have authority to allow extensions of the timeframe. (per the CMS website) 26
Sprinkler Compliance in Existing Portfolio Total # of 232 projects that are NH s = 1,849 Fully Sprinklered on website = 1,702 (92%) Partially Sprinklered / Data Not Available on website = 144 (7%) The vast majority of these have done any required improvements to comply but are awaiting the next State Inspection Not Sprinklered on website = 3 (.17%) On all of these the work is complete (awaiting inspection by State). 27
Sprinkler Compliance in Existing Portfolio Continued . ORCF is closely monitoring the projects where work is still progressing to ensure they complete the work in a timely manner. ORCF will continue to monitor compliance until all insured projects are listed as Fully Sprinklered on the CMS website. Ongoing discussions with the State Regulatory entities in Illinois and New York where more than half of our Partially Sprinklered projects are located. 28
Sprinkler Compliance for New Applications If you are bringing a loan to ORCF for Mortgage Insurance, verify compliance on the CMS website If not listed in the website, contact leanthinking@hud.gov prior to submission 29
Claims Activity FY 2009-2013YTD ORCF Assignments by Count 18 16 14 12 8 AL 10 4 ICF NH 8 BC 6 4 6 4 8 4 2 2 4 2 2 2 1 0 2009 2010 2011 2012 2013 32
Claims Activity FY2009-2013 YTD ORFC Assignments by UPB (000's) $120,000 $100,000 $56,889 $80,000 AL ICF $60,000 NH $9,685 BC $40,000 $53,388 $45,695 $28,643 $20,000 $12,396 $19,119 $7,566 $7,266 $6,243 $2,845 2010 $2,276 2013 $- 2009 2011 2012 33
Characteristics of FY 2013 Assignments 1 of the 5 was New Construction 232 ALF Illinois questionable operator and low occupancy 4 of 5 were done under 232/223f 2 of these Texas MI - Money Follows the Patient Other two: SNF and ALF (occupancy problems) Borrower/Operator Quality: No claims on projects UW by OHP Project being approved at LC exhibit strong, experienced borrower/operators 34
Star Ratings-National Average National ORCF Average Star Rating for Skilled Nursing Facilities Insured in 2013- 3.05 (223f s) 35
Asset Management Initiatives Specialization: We are developing teams and revising processes: TPA s R4R/Residual Receipts Releases Non-Critical Repair Escrow Administration Hope to speed up responses and follow more Lean processes Economies of Scale 36
Asset Management Initiatives Quarterly Financials and Portal Contract: Working with Contractor to Develop System We ll be testing with lenders first To Volunteer as a pilot participant- email leanthinking@hud.gov 37
Five Asset Management Metrics Financial Ratio / Indicator Formula Explanation Purpose Ability to Pay Mortgage NOI (Mortgage Principal + Mortgage Interest Payment + MIP) Operating Cash + Investments1 Total Expenses - Depreciation - Amortization Current Liabilities Total Expenses - Depreciation Amortization Should be higher than 1.2. Below 1 would trigger Troubled Status. 1 Debt Service Coverage (DSCR) Should be greater than 14 days. Less than 7 days could trigger Troubled Status. x Days in Period Ability to Pay Bills 2 Days Cash on Hand Should be less than 70. Greater than 90 could trigger Troubled Status. x Days in Period Ability to Pay Bills 3 Average Payment Period Should be positive. Negative working capital will restrict operator distributions. Should be less than 70. Greater than 90 could trigger Troubled Status. Current Assets - Current Liabilities 4 Working Capital Liquidity Patient Accounts Receivable Total Revenues 5Days in Accounts Receivable (AR) x Days in Period Liquidity 38
Loan Modifications We ve developed a standardized process for this including the input from GNMA where applicable. We currently have 22 Loan Modifications in various stages of review. Specialized team: Ellen Dickason Simon Kleinman Art Stein Jerry Bitting:on troubled loans 39
Coming Soon Check out website (which is getting revamped to serve you better) Lean training 2014- watch the email blast/website for an upcoming notice Board and Care Regulations updated and on the web by end of calendar year 2530 Basics Webcast- end of calendar year on Web 41
Thank You! www.hud.gov/healthcare Please email 232 related questions to: leanthinking@hud.gov 42








![Year-End Business Report for [Company Name]](/thumb/131798/year-end-business-report-for-company-name.jpg)


