Tomato Pomace as an Alternative Feed for Poultry in India
Tomato pomace is explored as a cost-effective alternative feed for poultry production in India due to the rising cost and scarcity of traditional feed ingredients. This waste product from the tomato industry shows promise in providing nutrition for poultry, addressing the challenges of feeding costs, and utilizing agricultural by-products. The significant tomato production in various states of India contributes to the availability of this potential feed resource.

Download Presentation

Please find below an Image/Link to download the presentation.
The content on the website is provided AS IS for your information and personal use only. It may not be sold, licensed, or shared on other websites without obtaining consent from the author. Download presentation by click this link. If you encounter any issues during the download, it is possible that the publisher has removed the file from their server.
E N D
Presentation Transcript
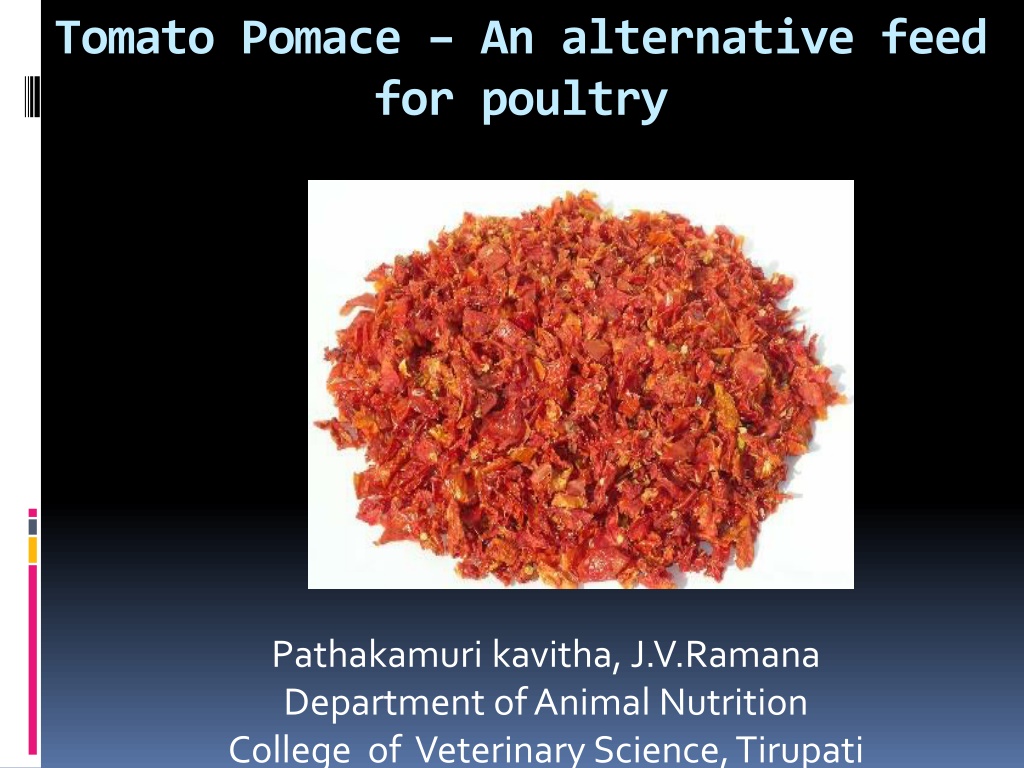
Tomato Pomace An alternative feed for poultry Pathakamuri kavitha, J.V.Ramana Department of Animal Nutrition College of Veterinary Science, Tirupati
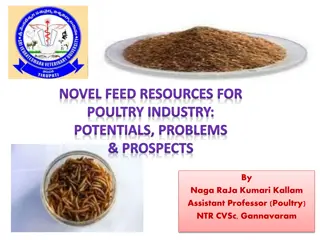
Feed cost accounts for 70-75 % of total cost of production. Availability and cost of feed ingradients for poultry diets are the major problems, has prompted the need for seeking other feed resources, especially agricultural and industrial by-products. In India a shortage of 25% concentrates constituting 32% of protein requirement has been estimated (FAO,2013). The wastes from fruit and vegetable industry can be used as a potential source of newer cheap feed resources.
Tomato is one of the most important protective food crops of India. It is grown in 0.879 M ha area with 18.227 M MT production and 20.7 MT/ha productivity. The major tomato producing states are Bihar, Karnataka, Uttar Pradesh, Orissa, Andhra Pradesh, Maharashtra, Madhya Pradesh and West Bengal. 29% of total national production is from Andhra Pradesh.
Tomato Production in India (Source: Indian horticultural data base-2013) Year Area ( 000 HA) % of total veg. area Production ( 000 MT) % of total veg. production Productivity (MT/HA) 2001-02 458.1 7.4 7462.3 8.0 16.3 2002-03 478.8 7.9 7616.7 9.0 15.9 2003-04 502.8 8.0 8125.6 8.7 16.2 2004-05 505.4 7.5 8825.4 8.7 17.5 2005-06 546.1 7.6 9820.4 8.9 18.0 2006-07 596.0 7.9 10055.0 8.7 16.9 2007-08 566.0 7.2 10303.0 8.0 18.2 2008-09 599.0 7.5 11149.0 8.6 18.6 2009-10 634.4 7.9 12433.2 9.3 19.6 2010-11 865.0 10.2 16826.0 11.5 19.5 2011-12 907.1 10.1 18653.3 11.9 20.6 2012-13 879.6 9.6 18226.6 11.2 20.7
Tomato Production(000MT) Trend in India 20000 18000 16000 14000 12000 10000 8000 6000 4000 2000 0 Source: Indian Horticulture data base-2013
State wise production(000MT) of Tomato in India State 2012-13 5218.1 Andhra Pradesh 1916.6 Karnataka 1845.0 Madhya Pradesh 1382.78 Odisha 1156.72 Gujarat 1126.25 Bihar 1125.6 West Bengal 1050.0 Maharashtra 762.22 Chhattisgarh 413.71 Himachal Pradesh Others 2229.7 Total 18226.6
Tomato Production('000 MT) Others 12% Himachal Pradesh 2% Andhra Pradesh 29% Chattisgarh 4% Maharashtra 6% West Bengal 6% Karnataka 11% Bihar 6% Gujarat 6% Madhya Pradesh 10% Odisha 8%
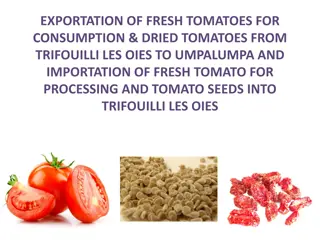
Tomato Pomace The tomato pomace is a by-product obtained from the processing of tomatoes for concentrated paste, juice, puree, sauce and ketchup. The solid waste which remains after extraction process consists of peels, cores, seeds, trimmings and cull tomatoes. About 2% of tomatoes are processed for value added products in India. When tomatoes are processed into products, 10% to 30% of their weight becomes waste or pomace . According to Safamehr et al(2011 )tomato pomace contains 90% DM, 8.1% fat, 19.68% protein and 29.75% crude fiber. Moreover, it contains 13% more lysine than soybean protein (AL-Betawi, 2005), a good source of vitamin B, fair source of vitamin A and no known antinutritive factors, and 2130 kcal/kg metabolizable energy (NRC, 1988).
Chemical composition of DTP DTP 89.56 90.99 22.39 12.23 40.10 9.01 16.27 3.63 0.56 0.48 Nutrient Dry Matter (DM) Organic Matter (OM) Crude Protein (CP) Ether Extract (EE) Crude Fibre (CF) Total Ash (TA) Nitrogen Free Extract (NFE) Acid Insoluble Ash (AIA) Calcium (Ca) Phosphorus (P) *On dry matter basis except for DM
Ingredient composition (%) of broiler starter diets (BIS,1992) Ingradient T1&T2 T3 & T4 T5 & T6 T7 & T8 Maize 52 51 49.5 48 Dried tomato pomace 0 5 10 15 Soybean meal 30 28 26 24 Fish meal 10 10 10 10 Mineral mixture with salt 3 3 3 3 Saw dust 5 3 1.5 0 Feed additives + + + + Total 100 100 100 100
Chemical composition* (%) of broiler starter diets Constituents T1&T2 T3 & T4 T5 & T6 T7 & T8 Dry matter 90.96 90.49 90.37 90.25 Organic matter 89.74 89.55 89.23 89.20 Crude protein 23.25 23.53 23.46 23.62 Ether extract 1.86 2.31 2.92 3.46 Crude fibre 6.81 7.43 8.36 9.21 Total ash 10.26 10.45 10.77 10.80 Nitrogen free extract Acid insoluble ash ME kcal / kg (calculated) Protein : Energy ratio Calcium 57.82 56.28 54.49 52.91 3.07 3.11 3.19 3.14 2712 2733 2738 2744 1 : 116 1 : 116 1 : 116 1 : 116 1.67 1.70 1.69 1.69 Phosphorus 1.02 1.04 1.01 1.00
Ingredient composition (%) of broiler finisher diets T1&T2 T3 & T4 T5 & T6 T7 & T8 Ingradient Maize 61 59.5 58 56.5 Dried tomato pomace Soybean meal 0 5 10 15 21.5 19.5 17.5 15.5 Fish meal 10 10 10 10 Mineral mixture with salt 3 3 3 3 Saw dust 4.5 3 1.5 0 * Feed additives Total + + + + 100 100 100 100
Chemical composition* (%) of broiler finisher diets Constituents T1&T2 T3 & T4 Dry matter 90.38 Organic matter Crude protein 20.28 Ether extract 1.81 Crude fibre 6.37 Total ash 9.73 Nitrogen free extract Acid insoluble ash ME kcal / kg (calculated) Protein : Energy ratio Calcium 1.66 Phosphorus 0.99 T5 & T6 T7 & T8 90.43 90.08 90.47 89.95 90.45 89.79 90.27 20.33 2.56 6.99 9.92 60.20 20.32 3.01 8.01 10.05 58.61 20.34 3.55 8.91 10.21 56.99 61.81 3.04 3.14 3.18 3.15 2781 2786 2791 2796 1 : 137 1 : 137 1 : 137 1 : 137 1.67 0.98 1.67 0.97 1.66 0.98
Composition of Polyzyme Name of the enzyme IU / gm Xylanase Phytase Cellulase Beta glucanase Pectinase Alpha amylase Protease Alpha-galactosidase Beta-galactosidase : : : : : : : : : 8000 100 35 150 100 1500 500 800 450
Effect of level of DTP inclusion in broiler diets with or without enzyme supplementation on average body weight gain (g) Body weight(g) 1860 1840 1820 1800 1780 Body weight(g) 1760 1740 1720 1700 1680 T1 T2 T3 T4 T5 T6 T7 T8
Effect of inclusion of different levels of DTP on body weight gain of broilers Body weight(g) 1810 1800 1790 1780 1770 1760 1750 1740 1730 1720 0% DTP 5% DTP 10%DTP 15% DTP
Effect of level of DTP inclusion in broiler diets with or without enzyme supplementation on feed intake (g) Feed intake (g) 3900 3850 3800 3750 3700 3650 Feed intake (g) 3600 3550 3500 3450 3400 T1 T2 T3 T4 T5 T6 T7 T8
Effect of inclusion of different levels of DTP on feed intake(g) of broilers Feed intake (g) 3850 3803.76 3800 3750 3697.6 3700 Feed intake 3665.43 3661.4 3650 3600 3550 0% DTP 5% DTP 10% DTP 15% DTP
Effect of level of DTP inclusion in broiler diets with or without enzyme supplementation on feed efficiency Feed intake/Kg gain 2.16 2.14 2.12 2.1 2.08 2.06 Feed intake/Kg gain 2.04 2.02 2 1.98 1.96 T1 T2 T3 T4 T5 T6 T7 T8
Effect of inclusion of different levels of DTP on feed intake/kg gain in broilers broilers 2.16 2.14 2.14 2.12 2.11 2.1 2.08 2.06 2.06 2.04 2.04 2.02 2 1.98 0% DTP 5% DTP 10% DTP 15% DTP
Effect of level of DTP inclusion in broiler diets with or without enzyme supplementation on level of serum triglycerides and serum cholesterol 200 180 160 140 120 Serum Triglycerides 100 Serum Cholesterol 80 60 40 20 0 T1 T2 T3 T4 T5 T6 T7 T8
Effect of inclusion of different levels of DTP on the level of serum triglycerides and serum cholesterol 175 170.33 170 163.41 165 160.75 159.2 160 156.2 154.43 155 Serum Triglycerides (mg/dl) 149.79 150 Serum Cholesterol (mg/dl) 145.94 145 140 135 130 0% DTP 5% DTP 10% DTP 15% DTP
Effect of level of DTP inclusion in broiler diets with or without enzyme supplementation on LDL-C (mg/dl) LDL-C 35 30 25 20 LDL-C 15 10 5 0 T1 T2 T3 T4 T5 T6 T7 T8
Effect of inclusion of different levels of DTP on the level of serum LDL-C LDL-C mg/dl 35 30.76 30 27.6 23.96 25 20.51 20 15 10 5 0 0% DTP 5% DTP 10% DTP 15% DTP
Effect of level of DTP inclusion in broiler diets with or without enzyme supplementation on breast muscle cholesterol (mg/100g of meat) 70 59.33 60 57.07 54.54 52.58 50.98 50.91 49.77 50 41.15 40 30 20 10 0 T1 T2 T3 T4 T5 T6 T7 T8
Effect of level of DTP inclusion in broiler diets on breast muscle cholesterol (mg/100g of meat) 60 55.96 53.99 52.15 50 46.07 40 30 20 10 0 0% DTP 5% DTP 10% DTP 15% DTP
Effect of level of DTP inclusion in broiler diets on thigh muscle cholesterol (mg/100g of meat) 136.78 140 116.54 120 114.19 108.86 100 80 60 40 20 0 0% DTP 5% DTP 10% DTP 15% DTP
Effect of level of DTP inclusion in broiler diets on Feed cost/kg gain Feed cost(Rs.)/kg gain 59 58 57 56 Feed cost(Rs.)/kg gain 55 54 53 52 T1 T2 T3 T4 T5 T6 T7 T8
Veysel Ayhan and Sedat Aktan (2004) suggested that DTP can be used as a feed ingradient in broiler ration with a level of 5%. Melkamu Bezabih Yitbarek (2012) reported that weight gain and feed efficiency are higher at 5% DTP inclusion in Rhode Island Red grower chicks. Safamehr.et al .,2011 included DTP at 0,4,8 & 12 % levels with and without enzyme supplementation in layer rations and observed decreased serum cholesterol but had no effect on yolk cholesterol with increase in the DTP level and the better performance was observed at 8% level of inclusion. Enzyme supplementation increased egg weight, but did not affected the egg production.
Jafari et al(2006) and Mansoori et al (2008) reported that feeding laying hens with diets containing DTP at inclusion rates upto 120g/kg did not effect egg production, food consumption and efficiency of the hen as well as egg weight and shell thickness. Md.Hamed Salajegheh et al (2012) reported DTP inclusion caused a significant increase in mean HDL cholesterol and decrease in serum LDL cholesterol content.


 Trend in India")
 of Tomato in India")
")


 of broiler starter diets")
 of broiler starter diets")
 of")
 of broiler finisher")


 suggested that")
 and Mansoori et al (2008) reported")