Exploring Forest Change Impact on Carbon Storage
Explore the impact of human activities on forest change and carbon storage through map analysis and pixel calculations. Students investigate the correlation between forest coverage and carbon stored in different areas, fostering understanding of ecosystem disruptions and climate change factors.

Download Presentation

Please find below an Image/Link to download the presentation.
The content on the website is provided AS IS for your information and personal use only. It may not be sold, licensed, or shared on other websites without obtaining consent from the author. Download presentation by click this link. If you encounter any issues during the download, it is possible that the publisher has removed the file from their server.
E N D
Presentation Transcript
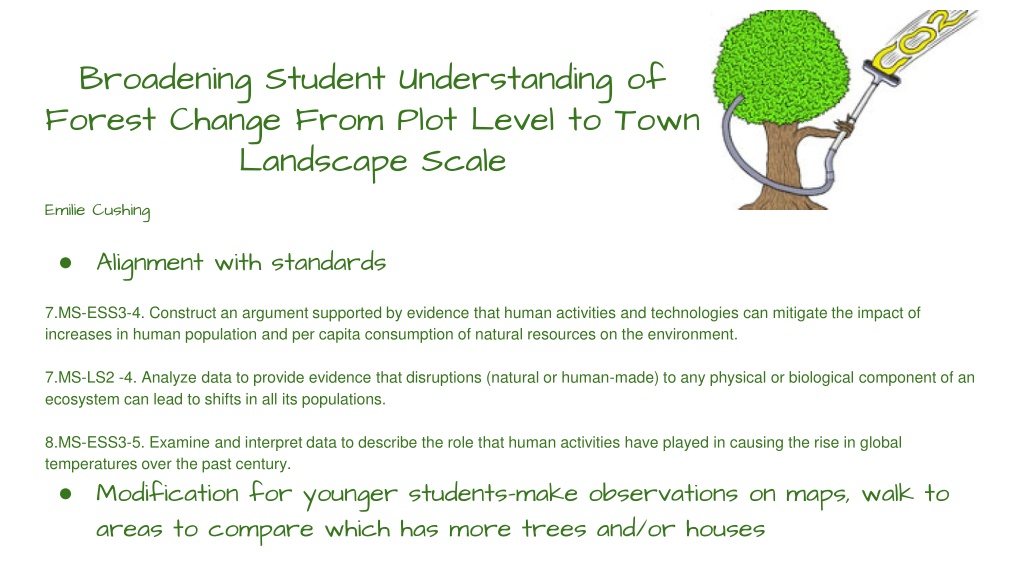
Broadening Student Understanding of Forest Change From Plot Level to Town Landscape Scale Emilie Cushing Alignment with standards 7.MS-ESS3-4. Construct an argument supported by evidence that human activities and technologies can mitigate the impact of increases in human population and per capita consumption of natural resources on the environment. 7.MS-LS2 -4. Analyze data to provide evidence that disruptions (natural or human-made) to any physical or biological component of an ecosystem can lead to shifts in all its populations. 8.MS-ESS3-5. Examine and interpret data to describe the role that human activities have played in causing the rise in global temperatures over the past century. Modification for younger students-make observations on maps, walk to areas to compare which has more trees and/or houses
Map Exploration Using the map, answer the following questions in complete sentences. 1. Look at the color coded key on the map. What is most noticeable to you about the map? 2. Now, look at the bar graph of comparing town areas. Give two pieces of information from the graph. Be as specific as possible. 3. Look at the table above the graph. How was Average Forest Carbon calculated?
Estimating Amount of Carbon Stored in Two Areas Using Maps Materials: forested map, pixelated map, transparency of graph paper, thin- tipped dry erase pen, ruler On the aerial view map, locate one square that is heavily forested (Area 1), and one square that looks less forested (Area 2). On the pixelated map, locate these same two squares. Turn to your neighbor and discuss: 3. Which area do you think would have more stored carbon? 4. How could you determine the amount of carbon stored? 5.Look at the materials list above. Using these materials, (or others), come up with a plan to determine how many pixels in each square are forested. Write your plan below: 1. 2.
6. Using your plan, determine total number of pixels that are forested. Number of pixels in Area 1: _____________ Number of pixels in Area 2:_____________ 7. Now we need to answer the original question-- How much carbon is stored in each area? What what additional information do you need to determine this? 8. Here is an additional piece of information: there are 11 pixels in one hectare. Using this information, and information from the map, how much carbon is in one pixel? Show your work below. Amount of carbon in one pixel: ________________Mg 9. Now, determine how much carbon is in each area, using your answers from #6 and #8. Show your work below. Amount of Carbon in Area 1:______________Mg Amount of Carbon in Area 2:_____________Mg