Understanding Quantitative Decision Making in Biostatistics

 undefined

Q
u
a
n
t
i
t
a
t
i
v
e
D
e
c
i
s
i
o
n
M
a
k
i
n
g
(
Q
D
M
)
Jacquie Christie
Biostatistics,
GlaxoSmithKline
On behalf of Graeme Archer
and Jacquie Christie
1
•
Why we need Quantitative Decision Making
•
What is Quantitative Decision Making
1.
Targets and Evidence Levels
2.
Risks
3.
Probability of Success
4.
Conditional Probability of Success
•
Summary and further considerations.
•
Worked Example
A
g
e
n
d
a
The problem - R&D Attrition Rates
W
h
y
D
o
W
e
N
e
e
d
Q
u
a
n
t
i
t
a
t
i
v
e
D
e
c
i
s
i
o
n
-
M
a
k
i
n
g
?
3
W
h
a
t
D
o
e
s
Q
D
M
B
r
i
n
g
?
4
•
Q
u
a
n
t
i
t
a
t
i
v
e
D
e
c
i
s
i
o
n
M
a
k
i
n
g
e
n
a
b
l
e
s
•
Development plans and studies to be designed optimally.
•
Decision risks can be quantified and minimised.
•
The utility of studies to be quantified
•
B
i
a
s
i
s
m
i
n
i
m
i
s
e
d
.
•
Confirmation bias
1
.
T
a
r
g
e
t
a
n
d
E
v
i
d
e
n
c
e
L
e
v
e
l
s
S
e
t
S
u
c
c
e
s
s
C
r
i
t
e
r
i
a
S
e
t
F
a
i
l
u
r
e
C
r
i
t
e
r
i
a
–
T
A
R
G
E
T
v
a
l
u
e
s
o
f
t
h
e
T
R
U
E
d
r
u
g
e
f
f
e
c
t
–
Minimum Value = MV
–
the smallest true value that would be of interest
–
anything less than the MV is unlikely to be a reimbursable medicine
–
Target Value = TV
–
The true value we desire
–
This would enable successful approval and commercialisation of the drug.
For each Decision-Making endpoint
S
t
e
p
1
a
)
S
e
t
T
a
r
g
e
t
s
6
Anchored against the targets
P
o
s
i
t
i
v
e
a
n
d
N
e
g
a
t
i
v
e
O
u
t
c
o
m
e
s
7
M
V
T
V
T
h
e
m
o
r
e
e
v
i
d
e
n
c
e
t
h
a
t
Δ
>
M
V
,
t
h
e
m
o
r
e
w
e
w
a
n
t
t
o
G
O
–
P
r
o
b
a
b
i
l
i
t
y
t
h
r
e
s
h
o
l
d
s
t
o
c
o
n
c
l
u
d
e
a
p
o
s
i
t
i
v
e
o
r
n
e
g
a
t
i
v
e
o
u
t
c
o
m
e
–
Positive evidence: against the Minimum Value (MV)
–
How confident do we want to be that we are better than the MV?
–
Negative evidence: against the Target Value (TV)
–
How confident do we want to be that we are below the TV?
For each Decision-Making endpoint
S
t
e
p
1
b
)
S
e
t
E
v
i
d
e
n
c
e
L
e
v
e
l
s
–
P
o
s
i
t
i
v
e
t
h
e
r
e
i
s
a
t
l
e
a
s
t
8
0
%
p
r
o
b
a
b
l
y
t
h
a
t
t
h
e
t
r
u
e
t
r
e
a
t
m
e
n
t
e
f
f
e
c
t
i
s
>
M
V
–
N
e
g
a
t
i
v
e
t
h
e
r
e
i
s
a
t
l
e
a
s
t
9
0
%
p
r
o
b
a
b
i
l
i
t
y
t
h
a
t
t
h
e
t
r
u
e
t
r
e
a
t
m
e
n
t
e
f
f
e
c
t
i
s
<
T
V
–
I
n
c
o
n
c
l
u
s
i
v
e
N
e
i
t
h
e
r
p
o
s
i
t
i
v
e
o
r
n
e
g
a
t
i
v
e
(
o
r
b
o
t
h
)
E
x
a
m
p
l
e
R
u
l
e
s
9
–
Based on the chosen study design (sample size, variability, decision rules), what value do
you need to be to make a decision
–
The
minimum critical value
of treatment effect which concludes
POSITIVE
evidence
–
The
maximum critical value
of treatment effect which concludes
NEGATIVE
evidence
Calculate the Critical Values
I
n
t
e
r
p
r
e
t
i
n
g
t
h
e
R
u
l
e
Decision rule in terms of observed values
I
f
2
0
.
2
%
i
s
o
b
s
e
r
v
e
d
t
h
e
r
e
i
s
a
8
0
%
p
r
o
b
a
b
i
l
i
t
y
t
h
a
t
t
h
e
t
r
u
e
e
f
f
e
c
t
i
s
>
=
1
5
%
(
M
V
)
I
f
1
1
.
9
%
i
s
o
b
s
e
r
v
e
d
t
h
e
r
e
i
s
a
9
0
%
c
h
a
n
c
e
t
h
e
t
r
u
e
e
f
f
e
c
t
i
s
<
=
2
0
%
(
T
V
)
2
.
R
i
s
k
s
Q
u
a
n
t
i
f
y
t
h
e
r
i
s
k
o
f
a
n
i
n
c
o
r
r
e
c
t
c
o
n
c
l
u
s
i
o
n
P
o
s
i
t
i
v
e
t
h
e
r
e
i
s
a
t
l
e
a
s
t
8
0
%
p
r
o
b
a
b
l
y
t
h
a
t
t
h
e
t
r
u
e
t
r
e
a
t
m
e
n
t
e
f
f
e
c
t
i
s
>
M
V
(
1
5
%
)
N
e
g
a
t
i
v
e
t
h
e
r
e
i
s
a
t
l
e
a
s
t
9
0
%
p
r
o
b
a
b
i
l
i
t
y
t
h
a
t
t
h
e
t
r
u
e
t
r
e
a
t
m
e
n
t
e
f
f
e
c
t
i
s
<
T
V
(
2
0
%
)
I
n
c
o
n
c
l
u
s
i
v
e
N
e
i
t
h
e
r
positive or negative
Quantify Risks
C
o
n
d
i
t
i
o
n
a
l
D
e
c
i
s
i
o
n
O
p
e
r
a
t
i
n
g
C
h
a
r
a
c
t
e
r
i
s
t
i
c
s
W
a
v
e
P
l
o
t
13
3
.
P
r
o
b
a
b
i
l
i
t
y
o
f
S
u
c
c
e
s
s
S
t
e
p
3
)
F
u
r
t
h
e
r
E
v
a
l
u
a
t
i
o
n
o
f
t
h
e
s
t
u
d
y
15
The wave plots give the probabilities of
go/consider/stop CONDITIONAL (
if
) on
different possible true treatment differences
The true treatment effect remains uncertain
The plot indicates a very high probability of a
positive decision when the true treatment
effect is > 25%.
But how likely is it that the true effect
is
> 25?
Probability of Success
T
h
e
p
r
i
o
r
:
a
p
r
o
b
a
b
i
l
i
t
y
d
i
s
t
r
i
b
u
t
i
o
n
t
o
d
e
s
c
r
i
b
e
t
h
e
c
u
r
r
e
n
t
u
n
d
e
r
s
t
a
n
d
i
n
g
a
b
o
u
t
t
h
e
t
r
u
e
t
r
e
a
t
m
e
n
t
d
i
f
f
e
r
e
n
c
e
16
17
Prior Distribution over Wave Plot
3
)
C
a
l
c
u
l
a
t
e
S
t
u
d
y
P
o
S
Probability of
Success
P
r
i
o
r
d
i
s
t
r
i
b
u
t
i
o
n
w
e
i
g
h
t
o
n
z
e
r
o
4
.
C
o
n
d
i
t
i
o
n
a
l
P
r
o
b
a
b
i
l
i
t
y
o
f
S
u
c
c
e
s
s
PoS of the subsequent study, conditioned on a positive outcome of the current study
•
Map possible observed Phase 2 results to Phase 3 POS
S
t
e
p
4
)
S
u
b
s
e
q
u
e
n
t
S
t
u
d
y
C
o
n
d
i
t
i
o
n
a
l
P
o
S
M
i
n
i
m
u
m
P
h
a
s
e
2
d
a
t
a
t
h
a
t
a
c
h
i
e
v
e
s
a
g
o
,
g
i
v
e
s
8
0
%
p
r
o
b
a
b
i
l
i
t
y
o
f
p
h
a
s
e
3
s
u
c
c
e
s
s
The
tougher we set the Phase 2
rules, the
higher the Probability of
success in Phase 3.
–
The “average” Phase 3 POS based on any positive
outcome in Phase 2, weighted by the prior.
–
Before phase 2
Phase 3 PoS : 30%
–
After phase 2 (assuming positive outcome)
Minimum Conditional Phase 3 PoS: 80%
Expected Conditional Phase 3 PoS: 86%
R
i
s
k
D
i
s
c
h
a
r
g
e
20
Prior distribution for
–
Extrapolating endpoints and other design changes
between phases can be difficult, but is necessary
–
I
f
t
h
e
s
t
u
d
y
i
s
n
o
t
a
b
l
e
t
o
d
i
s
c
h
a
r
g
e
r
i
s
k
f
o
r
f
u
t
u
r
e
d
e
v
e
l
o
p
m
e
n
t
,
t
h
e
n
w
h
y
p
r
o
c
e
e
d
w
i
t
h
t
h
e
s
t
u
d
y
a
t
a
l
l
?
Quantify the utility of the study in terms of risk discharge
–
Methodology can be extended to
–
Multi-endpoint decision rules
–
Interim analysis decision rules
–
Phase I to phase II
–
Safety, biomarker, PK endpoints etc.
F
u
r
t
h
e
r
C
o
n
s
i
d
e
r
a
t
i
o
n
s
–
Decision making frameworks are critical for successful drug development
–
Pre-defined targets and success evidence levels ensure studies are designed optimally
–
All important risks are quantified and transparent to decision makers
–
Studies de-risk the subsequent studies and overall development plan
Lower late stage attrition
Improved R&D productivity
More new medicines to patients.
22
C
o
n
c
l
u
s
i
o
n
s
Email: Jacquie.A.Christie@GSK.com
E
x
a
m
p
l
e
P
r
o
j
e
c
t
Back-up
P
r
i
o
r
d
i
s
t
r
i
b
u
t
i
o
n
f
o
r
p
r
i
m
a
r
y
e
n
d
p
o
i
n
t
(
r
e
s
p
o
n
s
e
)
f
o
r
G
S
K
X
X
X
24
•
According to the prior, we are
•
46% sure that the response for GSKXXX
is at least
45% (MV)
greater than
placebo.
•
22% sure that the response for GSKXXX
is at least
55% (TV)
greater than
placebo.
P
r
o
p
o
s
e
d
D
e
s
i
g
n
a
n
d
D
e
f
i
n
i
t
i
o
n
s
o
f
P
o
s
i
t
i
v
e
&
N
e
g
a
t
i
v
e
O
u
t
c
o
m
e
s
25
O
u
t
c
o
m
e
s
b
a
s
e
d
o
n
r
e
s
p
o
n
s
e
a
t
w
e
e
k
2
4
P
o
s
i
t
i
v
e
o
u
t
c
o
m
e
:
A
t
l
e
a
s
t
8
0
%
s
u
r
e
t
h
a
t
t
h
e
t
r
u
e
d
i
f
f
e
r
e
n
c
e
s
i
s
≥
4
5
%
This equates to an observed difference of ~ 52% or more.
N
e
g
a
t
i
v
e
o
u
t
c
o
m
e
:
A
t
l
e
a
s
t
9
0
%
s
u
r
e
t
h
a
t
t
h
e
t
r
u
e
d
i
f
f
e
r
e
n
c
e
i
s
<
5
5
%
This equates to an observed difference of ~ 45% or less.
According to the prior and this proposed design, there is a 30% chance of a positive outcome, and a
66% chance of a negative outcome.
D
e
s
i
g
n
S
u
m
m
a
r
y
•
Randomized, parallel group, placebo controlled,
phase IIb.
•
Proportion of subjects achieving response at week 24 is the decision making endpoint.
S
t
u
d
y
D
e
c
i
s
i
o
n
R
i
s
k
s
a
n
d
P
o
S
E
f
f
i
c
a
c
y
P
O
S
e
v
o
l
u
t
i
o
n
b
y
I
n
t
e
r
i
m
A
n
a
l
y
s
i
s
a
n
d
a
t
F
i
n
a
l
R
e
s
u
l
t
s
27
4
%
8
7
%
9
6
%
6
5
%
4
6
%
Quantitative Decision Making (QDM) in biostatistics enables optimal design of development plans and studies, quantifies decision risks, and minimizes bias. It involves setting targets and evidence levels, anchoring outcomes against targets, and establishing evidence thresholds for positive and negative outcomes. Ultimately, QDM enhances the success and efficiency of decision-making processes in the field of biostatistics.

Download Presentation

Please find below an Image/Link to download the presentation.
The content on the website is provided AS IS for your information and personal use only. It may not be sold, licensed, or shared on other websites without obtaining consent from the author. Download presentation by click this link. If you encounter any issues during the download, it is possible that the publisher has removed the file from their server.
E N D
Presentation Transcript
Quantitative Decision Making (QDM) Jacquie Christie Biostatistics, GlaxoSmithKline On behalf of Graeme Archer and Jacquie Christie 1
Agenda Why we need Quantitative Decision Making What is Quantitative Decision Making 1. Targets and Evidence Levels 2. Risks 3. Probability of Success 4. Conditional Probability of Success Summary and further considerations. Worked Example
Why Do We Need Quantitative Decision-Making? The problem - R&D Attrition Rates 3
What Does QDM Bring? Quantitative Decision Making enables Development plans and studies to be designed optimally. Decision risks can be quantified and minimised. The utility of studies to be quantified Bias is minimised. Confirmation bias 4
1. Target and Evidence Levels Set Success Criteria Set Failure Criteria
Step 1a) Set Targets For each Decision-Making endpoint TARGET values of the TRUE drug effect Minimum Value = MV the smallest true value that would be of interest anything less than the MV is unlikely to be a reimbursable medicine Target Value = TV The true value we desire This would enable successful approval and commercialisation of the drug. 6
Positive and Negative Outcomes Anchored against the targets TV MV The more evidence that > MV, the more we want to GO The more evidence that < TV, the more we want to STOP 7
Step 1b) Set Evidence Levels For each Decision-Making endpoint Probability thresholds to conclude a positive or negative outcome Positive evidence: against the Minimum Value (MV) How confident do we want to be that we are better than the MV? Negative evidence: against the Target Value (TV) How confident do we want to be that we are below the TV?
Example Rules Positive there is at least 80% probably that the true treatment effect is > MV Negative there is at least 90% probability that the true treatment effect is < TV Inconclusive Neither positive or negative (or both) 9
Interpreting the Rule Calculate the Critical Values Based on the chosen study design (sample size, variability, decision rules), what value do you need to be to make a decision The minimum critical value of treatment effect which concludes POSITIVE evidence The maximum critical value of treatment effect which concludes NEGATIVE evidence
Decision rule in terms of observed values If 20.2% is observed there is a 80% probability that the true effect is >=15% (MV) If 11.9% is observed there is a 90% chance the true effect is <=20% (TV)
2.Risks Quantify the risk of an incorrect conclusion
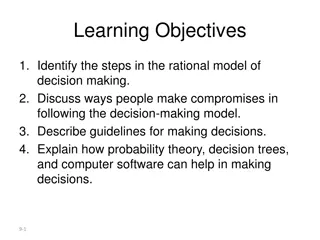
Conditional Decision Operating Characteristics Wave Plot Quantify Risks Positive there is at least 80% probably that the true treatment effect is > MV (15%) Negative there is at least 90% probability that the true treatment effect is <TV (20%) Inconclusive Neither positive or negative If the risk level of your proposed design is too high, or there is a very large consider zone CHANGE SOMETHING 13
Step 3) Further Evaluation of the study Probability of Success The wave plots give the probabilities of go/consider/stop CONDITIONAL (if) on different possible true treatment differences The true treatment effect remains uncertain The plot indicates a very high probability of a positive decision when the true treatment effect is > 25%. But how likely is it that the true effect is > 25? 15
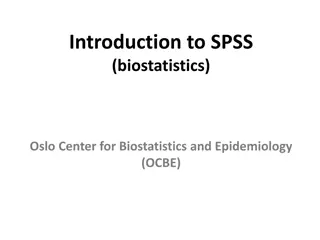
The prior: a probability distribution to describe the current understanding about the true treatment difference Previous trial data for this compound Pre-clinical & Biology Data Competitor Data Elicitation 16
3) Calculate Study PoS Prior Distribution over Wave Plot True effect Probability of making each decision for a given true effect Positive (%) Inconclusive (%) Negative (%) TV=20% 52% 38% 10% Assurance 18% 22% 70% Probability of Success 17 Prior distribution weight on zero
4. Conditional Probability of Success PoS of the subsequent study, conditioned on a positive outcome of the current study
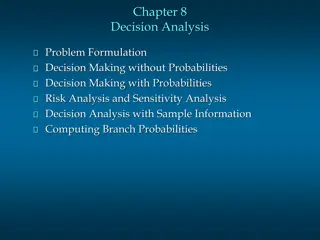
Step 4) Subsequent Study Conditional PoS Map possible observed Phase 2 results to Phase 3 POS Minimum Phase 2 data that achieves a go, gives 80% probability of phase 3 success The tougher we set the Phase 2 rules, the higher the Probability of success in Phase 3.
Risk Discharge Quantify the utility of the study in terms of risk discharge The average Phase 3 POS based on any positive outcome in Phase 2, weighted by the prior. Before phase 2 Phase 3 PoS : 30% After phase 2 (assuming positive outcome) Minimum Conditional Phase 3 PoS: 80% Expected Conditional Phase 3 PoS: 86% Prior distribution for Extrapolating endpoints and other design changes between phases can be difficult, but is necessary If the study is not able to discharge risk for future development, then why proceed with the study at all? 20
Further Considerations Methodology can be extended to Multi-endpoint decision rules Interim analysis decision rules Phase I to phase II Safety, biomarker, PK endpoints etc.
Conclusions Decision making frameworks are critical for successful drug development Pre-defined targets and success evidence levels ensure studies are designed optimally All important risks are quantified and transparent to decision makers Studies de-risk the subsequent studies and overall development plan Lower late stage attrition Improved R&D productivity More new medicines to patients. 22 Email: Jacquie.A.Christie@GSK.com
Back-up Example Project
Prior distribution for primary endpoint (response) for GSKXXX According to the prior, we are 46% sure that the response for GSKXXX is at least 45% (MV) greater than placebo. 22% sure that the response for GSKXXX is at least 55% (TV) greater than placebo. TV MV True Treatment Difference GSKXXX Placebo responders 24
Proposed Design and Definitions of Positive & Negative Outcomes Design Summary Randomized, parallel group, placebo controlled, phase IIb. Proportion of subjects achieving response at week 24 is the decision making endpoint. Outcomes based on response at week 24 Positive outcome: At least 80% sure that the true differences is 45% This equates to an observed difference of ~ 52% or more. Negative outcome: At least 90% sure that the true difference is <55% This equates to an observed difference of ~ 45% or less. According to the prior and this proposed design, there is a 30% chance of a positive outcome, and a 66% chance of a negative outcome. 25
Study Decision Risks and PoS True effect Probability of concluding go, stop, or neither Go (%) 67.8% 14.2% 0% 30.4% Inconclusive (%) 7.9% 7.4% 0% 3.7% Stop (%) 24.3% 78.4% 100% 66.0% TV=55% MV=45% No effect=0 Assurance
Efficacy POS evolution by Interim Analysis and at Final Results Futility 1 (N=30) Futility 2 (N=90) Timepoint: Start of Phase 2 End of Phase 2 Go decision at end of Phase 2 Event: Study start Continue at interim Continue at interim Phase 3 POS 22% 45% 68% 91% conditional on Event: 4% 46% 65% 87% 96% Prior for difference in Response where the denotes the probability of an effect >45% (MV) Probability of stopping 37% 59% Cost to stage-gate XXM XXM XXM 27


 Set Targets")

 Set Evidence Levels")


 Further Evaluation of the study")

 Calculate Study PoS")

 Subsequent Study Conditional PoS")


 for")