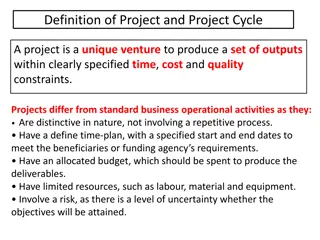
Understanding Project Cost Control and Performance Measurement

This content discusses the importance of project cost control systems in identifying excessive costs, forecasting total job costs, and updating company databases. It also explores key indicators in performance measurement such as BCWS, BCWP, and ACWP. Additionally, it delves into performance equations and the CostOverrun curve for effective project cost management.

Download Presentation

Please find below an Image/Link to download the presentation.
The content on the website is provided AS IS for your information and personal use only. It may not be sold, licensed, or shared on other websites without obtaining consent from the author. Download presentation by click this link. If you encounter any issues during the download, it is possible that the publisher has removed the file from their server.
E N D
Presentation Transcript
Objectives of Project Cost Control System 1. To identify those work types having excessive costs and to give an indication of how serious those overruns are. 2. To forecast the final total job cost. 3. To indicate the trend for each cost code, that is, whether the unit cost involved has been increasing or decreasing (evaluation of the effectiveness of cost reduction efforts). 4. To update the database of the company that will be used to estimate future works.
Project Time Control Project Cost Control System The cost estimate prepared for the project during the bidding process is the basis for cost control. Cost control for an engineering project is limited to the cost of labor, equipment, materials and site overheads. Control of cost and time should be linked together.
Three Key Indicators in Performance Measurement 1. Budgeted Cost of Work Scheduled (BCWS) is the budgeted amount of cost of the work scheduled to be accomplished in a given time period (including support and allocated overhead). (This is can be referred to as planned value of work to be accomplished [PV] .) 2. Budgeted Cost of Work Performed (BCWP) is the budgeted amount of cost for the work completed in a given time period, including support effort and allocated overhead. (This is can be referred to as earned value of work accomplished [EV] .) How to calculate BCWP Budgeted cost for work performed (BCWP) = Earned value of an activity = Percent completed for the activity * the activity budget Percent completed for an activity = [(Projected duration Remaining duration) / Projected duration] * 100 3. Actual Cost of Work Performed (ACWP) OR [AC] is the amount reported as actually expended in completing the particular work accomplished within a given time period.
Performance Equations Symbol Definition (BCWS) [PV] Budgeted Cost of Work Scheduled planned value of work to be accomplished (BCWP) [EV] Budgeted Cost of Work Performed earned value of work accomplished (ACWP) [AC] Actual Cost of Work Performed Cost Performance Under budget > 0 Work performed cost > Actual cost BCWP Within budget Cost Variance CV = BCWP-ACWP = 0 Work performed cost = Actual cost ACWP Over budget < 0 Work performed cost < Actual cost Cost Performance Under budget > 1 Work performed cost > Actual cost BCWP Within budget Cost Performance Index CPI = BCWP/ACWP = 1 Work performed cost = Actual cost ACWP Over budget < 1 Work performed cost < Actual cost Cost Performance Under run > 0 Performed cost > Earned BCWP (ACWP BCWP BCWP % Cost Overrun/ Underrun on run ) = 0 Performed cost = Earned ACWP Over run < 0 Performed cost < Earned The CostOverrun curve is a plot of the calculated percent over- or Underrun at any given time.
Performance Equations Symbol Definition (BCWS) [PV] Budgeted Cost of Work Scheduled planned value of work to be accomplished (BCWP) [EV] Budgeted Cost of Work Performed earned value of work accomplished (ACWP) [AC] Actual Cost of Work Performed Schedule (Time) Performance Ahead schedule > 0 Work performed > Work scheduled BCWP On schedule Schedule/Performance Variance SV = BCWP-BCWS = 0 Work performed = Work scheduled BCWS Behind scheduke Work performed < Work scheduled < 0 Schedule (Time) Performance Ahead schedule > 1 Work performed > Work scheduled BCWP On schedule Schedule Performance Index SPI = BCWP/BCWS = 0 Work performed = Work scheduled BCWS Behind scheduke Work performed < Work scheduled < 1
Cost Forecasting Equations Symbol Definition (BCWS) [PV] Budgeted Cost of Work Scheduled planned value of work to be accomplished (BCWP) [EV] Budgeted Cost of Work Performed earned value of work accomplished (ACWP) [AC] Actual Cost of Work Performed Budget Cost At Completion BAC = BCWSend Estimated Cost At Completion ??? = (?????? ???? ???? ?? ????) * BAC, OR (??? ???? ?????? ) ??? ???? ?????? ??? = ???? ?? ???? + Estimate to Completion ETC = EAC - ACWP Variance from original budget VB = EAC - BAC
BCWS [PV], BCWP [EV], and ACWP[AC] S-CURVES ACWP [AC] BCWS [PV] BCWP [EV]
BCWS, BCWP, and ACWP BCWP BCWP ACWP ACWP BCWS BCWP BCWP BCWS BCWP ACWP BCWP ACWP BCWS BCWS BCWP BCWP ACWP BCWS ACWP BCWS ACWP ACWP BCWS BCWS Fast & Low Fast & High Fast & Low Fast & High Under budget (costs below budget) & Ahead of Over budget (Over costs) & Ahead of schedule Fast & High Fast & High schedule (fast) (fast) BCWS BCWS BCWS BCWS BCWS Fast & Low Fast & Low ACWP BCWS BCWS BCWS ACWP BCWP BCWP ACWP ACWP BCWP BCWP BCWP BCWP BCWP ACWP ACWP ACWP ACWP BCWP Slow & High Slow & High Slow & High Slow & High Slow & Low Slow & Low Slow & Low Slow & Low Under budget (costs below budget) & Behind schedule (Slow) Over budget (Over cost) & Behind schedule (Slow)
BCWS, BCWP, and ACWP Performance report from integrated time/cost control system
Example The following time-scale diagram represents a small engineering project. The budgeted cost of each activity is shown in the table below. At the end of the 10th week, the field progress report gives you the following information: Activity A was completed on schedule. Activity B started as planned but it is expected to take four weeks more. Activity C started as planned but finished one week later. % age of completion of activity D is 60%. ACWP at the end of week 10 = SR 90400 Time (week) 12 13 1 2 3 4 5 6 7 8 9 10 11 14 15 16 17 18 19 20 21 22 23 A (5 weeks) B (8 weeks) E (7 weeks) F (3 weeks) C (5weeks) D (6 weeks) G (4 weeks) Activity Budgeted cost (SR) A B C D E F G 50000 12000 16000 24000 12000 21000 20000 Calculate the CV, SV, BAC, EAC, ETC, and comment on the progress of the work.
Example % age of completion of activity A = 100% Projected duration of activity B = 8 + 4 = 12 weeks % age of completion of activity B = 5/12 = 41.666666% % age of completion of activity C = 100% BCWS10 = A + C + 5/8*B + 5/6*D = 50000 + 16000 + 5/8*12000 + 5/6*24000 = SR 93500 [remark: 5/8 & 5/6 represent ratio off completion of activities B&D with respect to scheduled duration] BCWP10 = A + C + 0.4167*12000 + 0.60*24000 = SR 85400 [remark: 0.4167 & 0.6 represent ratio of completion of activities B&D with respect to actual completion duration] CV = BCWP ACWP = 85400 90400 = SR -5000 (Over Budget) SV = BCWP BCWS = 85400 93500 = SR -8100 (Behind Schedule) BAC = 50000 + 12000 + 16000 + 24000 + 12000 + 21000 + 20000 = SR 155000 EAC = [ACWP/BCWP]*BAC = [90400/85400]*155000 = SR 164075 ETC = EAC ACWP = 164075 90400 = SR 73675
Project Example1 Figure (1) shows a planned schedule and cost of the main product design project activities. Figure (2) gives the planned scheduled for the engineering task activities which should be done within 7 month. A control report should be reported at 3rd month.
Project Example1 Figure (2) shows that engineering task is done by 9 activities and the status of these activities at the end of 3rd month is reported as follows: Activity 1- system design: this activity is completed and it actual cost of work performed (ACWP) = $144 Activity 2- Subcontract specs: this activity is started and the scheduled completion is 90.4% while actual completion is 62.1% due delay with paid actual cost of work performed (ACWP) = $84 Activity 3- Material tests: this activity is completed and it actual cost of work performed (ACWP) = $22.5 Activity 4- Specs review: this activity is started and the scheduled completion is 68.75% while actual completion is 46.875% due delay with paid actual cost of work performed (ACWP) = $15.5 Activity 5- Drafting: this activity is started and the scheduled completion is 80.83% while actual completion is 49.167% due delay with paid actual cost of work performed (ACWP) = $59 Activity 6- Fabrication/assembly support: this activity is completed and it actual cost of work performed (ACWP) = $36 Activity 7- Fabrication/assembly process: this activity is started and the scheduled completion is 79.923% while actual completion is 48.462% due delay with paid actual cost of work performed (ACWP) = $67 Activity 8- Test support: this activity is started and the scheduled completion is 21% while actual completion is 21% due delay with paid actual cost of work performed (ACWP) = $21 Activity 9- Engineering release and review: this activity is not started yet
Project Example1 ENGINEERING SUBTASKS STATUS AT END OF MONTH 3 (thousands of dollars) Example of calculation: BCWS2 = 0.904*146 = 131 BCWP2 = 0.562*146 = 82 The status report is as shown in the table: Task Status BCW S $131.0 $131.0 132.0 22.0 22.0 97.0 29.0 100.0 21.0 BCWP ACWP System design Subcontract specs Material tests Specs review Drafting Fabrication/assembly support Fabrication/assembly process Test support Engineering review Total Completed Started Completed Started Started Completed Started Started Not Started $144.0 84.0 22.5 15.5 59.0 36.0 67.0 21.0 82.0 22.0 15.0 59.0 29.0 63.0 21.0 release and $554.0 $422.0 $449.0
Project Example1 Status summary of engineering subtasks in progress and estimate to complete. Task BCWS BCWP ACWP Status Subcontract specs $132 $82 $84 Behind schedule and over cost Specs review 22 15 15.5 Behind schedule and over cost Drafting 97 59 59 Behind schedule but within cost Fabrication/assembly process 100 63 67 Behind schedule and over cost Test support 21 21 ACWP 21 On schedule and within cost 449 Estimated at completion: =$812 K PCWP = 765 422 Summary:Engineering work is behind schedule and a cost overrun is occurring
D Project Example 2 For the following network, compute the early start cumulative costs for the project, and draw the result. A C F H 0 1 2 4 5 E G B 3 Duration Week 2 4 5 6 4 2 3 3 ES Time 0 0 2 2 7 7 11 9 LS Time 0 3 2 5 7 7 11 11 Cost per week, SR 400 200 300 400 350 200 300 200 Activity Depend on A A B, C B, C E D, F A B C D E F G H
Cost based on Time Scaled Network (ES) A (400) B (200) C (300) D (400) E (350) F (200) G (300) H (200) week Cost Cum. 1 2 3 4 5 6 7 8 9 10 11 12 13 14 600 600 900 900 700 700 700 950 550 550 550 500 300 300 600 1200 2100 3000 3700 4400 5100 6050 6600 7150 7700 8200 8500 8800
Cost based on Time Scaled Network (LS) A (400) B (200) C (300) D (400) E (350) F (200) G (300) H (200) week Cost Cum. 1 2 3 4 5 6 7 8 9 10 11 12 13 14 400 400 300 500 500 900 900 950 950 750 750 500 500 500 400 800 1100 1600 2100 3000 3900 4850 5800 6550 7300 7800 8300 8800
Cumulative Project Cost ES & LS Cumulative Cost for the Project. 10000 9000 8000 7000 Cost SR 6000 ES LS 5000 4000 3000 2000 1000 0 0 1 2 3 4 5 6 7 8 9 10 11 12 13 14 Duration Week
Project Example 3 : You are required to submit a progress report to your boss about the performance of an activity of a project. The activity s information as follow: number of units is (800); unit cost is SR 12 ; and planned productivity is 100 unit/day. Performances were measure at the end of day (3) and day (6) as follows: Period Cost at this period Number of units finished 250 320 day 0 to day 3 SR 3,600 day 4 to day 6 SR 3,700 a) Calculate the following information for each of the two periods (i.e. day 0 to day 3 and day 4 to day 6) and to date (i.e. day 0 to day 3 and day 0 to day 6). b) Draw a graphical report for ACWP, BCWP, and BCWS. Discuss the results. 1. This Period Period BCWP ACWP BCWS Variance Cost STATUS Sch. Schedule -600 Behind 240 Cost 0 - 3 4 - 6 SR 3000 SR 3600 SR 3600 -600 SR 3840 SR 3700 SR 3600 Over Bud. under Bud. 140 Ahead 2. To Date Period BCWP ACWP BCWS Variance Cost STATUS Sch. Behind Over Bud. SR 11,520 Behind Over Bud. SR 10,446 Estimate at Day ahead completion or behind Sch. -600 -360 Cost 0 - 3 0 - 6 SR 3000 SR 3600 SR 3600 -600 SR 6840 SR 7300 SR 7200 -460 0.5 0.3
Project Example 3 : b) At this rate, the contractor needs actions to reduce the cost and accelerate the time.
Project Example 4 : The following eight activities constitute an overall bar chart project that has twenty-week. Now 10 weeks finished on the project with and the project manager has the following Data: The weekly planned percentage of completion (inside each activity bar), The actual percentage of completion up to week 10 (in below activity bar and table), The Budget cost of each activity (in below table), Actual Expenses up to week 10 of each activity (in below table), The Critical Path is A-B-C-D (bolted bar), and Total Float of each activity (dash lines) ACT W1 W2 W3 W4 W5 W6 W7 W8 W9 W10 W11 W12 W13 W14 W15 W16 W17 W18 W19 W20 A 7% 14% 20% 27% 32% 100 % B 5% 10% 15% 19% 23% 28% 60 % C 4% 7% 11% 14% 18% 21% 25% 0 % D 40% 60% 0 % E 40% 60% 100 % F 7% 14% 20% 27% 32% 50 % G 40% 60% 100 % H 10% 20% 30% 40% 70 %
Project Example 4 : For this point in time (10 weeks after the start date): a) Calculate the values of the Budgeted Cost of Work Performed and Budgeted Cost of Work Scheduled for each activity? (8%) b) For each activity in progress, calculate the Cost and Schedule Performed Indices and state its budget and schedule status. (3%) c) Draw the weekly cumulative BCWS of activity B, determine its delay/Ahead week, and whether it will delay/accelerate the project or not and why. (5%) d) Determine the project cost variance and state if the project is over or under budget. (2%) e) Based on the performance of past 10 weeks, forecast the project completion cost at the end of the project, and its variance from original project budget. (2%)
Project Example 4 : Solution Parts a) and b), % of Budget Cost (SR) 8000 Actual Expenses (SR) 9000 BCWS (SR) 8000 BCWP (SR) 8000 Cost Status Schedule Status Act. CPI SPI Completion 100% A 1.13 1 B 60% 10000 6000 7200 6000 1 1.2 On Budget Behind 1 C D E F G 0% 0% 100% 50% 100% 11000 3000 4000 7000 5000 0 0 0 0 0 0 3500 4000 4000 4000 2870 5000 4000 3500 5000 0.88 1.143 0.8 0.82 1 Over Bud. Ahead H 70% 6000 3900 3600 4200 0.93 0.86 Under Bud. Ahead Total 54,000 30,400 30,670 30,700
Project Example 4 : Solution Parts c) 11000 10000 9000 8000 7000 SR 6000 5000 4000 3000 2000 1000 Week 0 0 1 2 3 4 5 6 7 Week
Project Example 4 : Solution Parts d) and e), This activity will delay the project because it is critical activity. d) Project cost Variance = BCWPproject ACWPproject = 30,700 30,400 = SR 300 (Under Budget) e) Budgeted Cost At Completion (BAC) = Budget Cost = SR 54,000 Estimated Cost At Completion (EAC) = [ACWP/BCWP]*BAC = SR 53,472.3 OR Estimated Cost At Completion (EAC) = ACWP + [(BAC BCWP) / CPI] = SR 53,472.3 Variance from original project budget = EAC BAC = SR -527.7 (Under Budget)


")
")