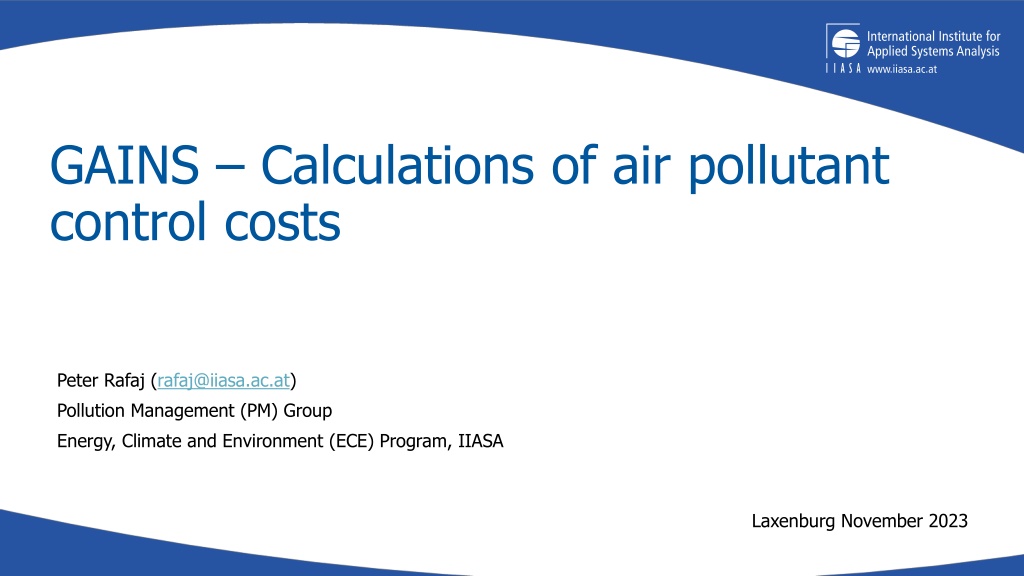
GAINS Calculations of Air Pollutant Control Costs and Cost-Effective Technologies
 undefined


GAINS – Calculations of air pollutant
control costs
Pollution Management (PM) Group
Energy, Climate and Environment (ECE) Program, IIASA
Laxenburg November 2023
Application rates of abatement measures:
% of capacity / activity
Cost concept used
•
All costs are in (economic) real terms (2005)
•
Societal costs:
o
Standard discount rate: 4 percent p.a.
o
Taxes
not included
o
Transaction & training costs not included
•
Feedback on economy not included (small)
•
Technology costs
o
Non-technical measures not included
o
Investment, Operating and Maintenance costs, Labour
cost, Energy costs, etc.
o
Are constant over time
Calculations principles
•
GAINS calculates annual costs of emission control
technologies consisting of:
o
Investment costs (annualized)
o
Fixed O+M costs
o
Variable O+M costs
C = I
ann
+ OM
fix
+ OM
var
Cost information in the literature
Example: Flue gas desulphurization (FGD)
Costs are country- and technology-specific
Technology-specific factors
:
•
Investments, fixed O+M
•
Demand for labour, energy, by-products
•
Lifetime of equipment
•
Removal efficiency
Country-specific factors:
•
Installation size, plant factors
•
Prices for labour, energy, by-products, etc.
•
Applicability
Units used
•
Costs per unit of activity
o
E.g. MEuro per PJ
•
Costs per ton of pollutant removed
o
E.g. Euro per ton of PM
•
“per year” is always implicit
Marginal costs
Marginal cost – extra cost for an additional measure related to
extra abatement of that measure
Where:
An example marginal cost curve for SO
2
This document provides insights into the GAINS calculations of annual costs for emission control technologies, including investment costs, fixed and variable operation and maintenance costs. It outlines specific cost information for technologies like Flue Gas Desulphurization (FGD), considering factors such as country-specific and technology-specific elements. Also, it highlights the applicability of cost concepts and factors influencing cost assessments in air pollutant control measures.

Download Presentation

Please find below an Image/Link to download the presentation.
The content on the website is provided AS IS for your information and personal use only. It may not be sold, licensed, or shared on other websites without obtaining consent from the author. Download presentation by click this link. If you encounter any issues during the download, it is possible that the publisher has removed the file from their server.
E N D
Presentation Transcript
GAINS Calculations of air pollutant control costs Peter Rafaj (rafaj@iiasa.ac.at) Pollution Management (PM) Group Energy, Climate and Environment (ECE) Program, IIASA Laxenburg November 2023
Application rates of abatement measures: % of capacity / activity JAPAN - Heavy Duty Diesel Vehicles control (%) INDIA - Power sector - PM2.5 control (%) CHINA - Power sector - SO2 control (%) 100 100 100 80 80 80 60 60 60 40 40 40 20 20 20 0 0 0 2010 2020 2030 2040 2050 2010 2020 2030 2040 2050 2010 2020 2030 2040 2050 High efficiency deduster EURO I EURO IV EURO VII EURO II EURO V EURO III EURO VI High efficiency flue gases desulphurisation Electrostatic precipitator: 2 fields Wet flue gases desulphurisation Electrostatic precipitator: 1 field Wet flue gases desulphurisation (retrofitted) In-furnace control - limestone injection Low sulphur coal (0.6 %S)
Cost concept used All costs are in (economic) real terms (2005) Societal costs: oStandard discount rate: 4 percent p.a. oTaxes not included oTransaction & training costs not included Feedback on economy not included (small) Technology costs oNon-technical measures not included oInvestment, Operating and Maintenance costs, Labour cost, Energy costs, etc. oAre constant over time
Calculations principles GAINS calculates annual costs of emission control technologies consisting of: oInvestment costs (annualized) oFixed O+M costs oVariable O+M costs C = Iann + OMfix + OMvar
Cost information in the literature Example: Flue gas desulphurization (FGD) Scrubber type Unit size MW Capital Cost $/kW O&M cost - fix $/kW O&M cost - var $/MWh Wet >400 100-250 2-8 0.5-2 Wet <400 250-1500 8-20 0.5-2 Spray dry >400 40-150 4-10 0.5-2 Spray dry <400 150-1500 10-300 0.5-2
Costs are country- and technology-specific Technology-specific factors: Investments, fixed O+M Demand for labour, energy, by-products Lifetime of equipment Removal efficiency Country-specific factors: Installation size, plant factors Prices for labour, energy, by-products, etc. Applicability
Units used Costs per unit of activity oE.g. MEuro per PJ Costs per ton of pollutant removed oE.g. Euro per ton of PM per year is always implicit
Marginal costs Marginal cost extra cost for an additional measure related to extra abatement of that measure Where:
An example marginal cost curve for SO2 3000 0.01 % S diesel oil FGD Marginal costs (EURO/ton SO2 removed) large industrial boilers 2500 FGD small industrial boilers 0.2 % S diesel oil 2000 0.6 % S heavy fuel oil FGD oil fired power plants FGD - baseload power plants 1500 1 % S heavy fuel oil 1000 Low sulfur coal Remaining measures 500 Present legislation 0 0 50 100 150 200 250 300 Remaining emissions (kt SO2)