Understanding Natural Capital and Ecosystem Services Valuation for Effective Policy Making
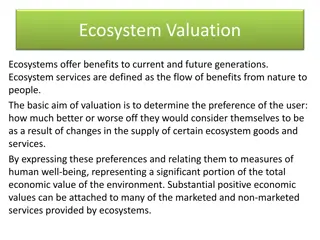
Natural capital and ecosystem services play a crucial role in shaping policies related to environmental conservation and resource management. Valuing ecosystem services helps assess human welfare impacts and address market failures in allocating resources. Issues such as land degradation and loss of biodiversity underscore the importance of incorporating environmental valuation in policy decisions to safeguard our ecosystems for future generations.

Download Presentation

Please find below an Image/Link to download the presentation.
The content on the website is provided AS IS for your information and personal use only. It may not be sold, licensed, or shared on other websites without obtaining consent from the author. Download presentation by click this link. If you encounter any issues during the download, it is possible that the publisher has removed the file from their server.
E N D
Presentation Transcript
Natural Capital, Ecosystem Services and Role of Environment Valuation in Policy Making H. M. Gunatilake Director, Environment and Safeguards Division Asian Development Bank
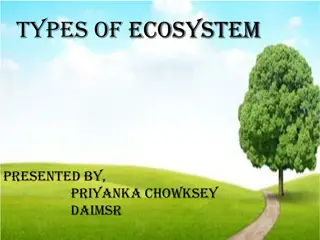
Outline A. Background B. Overview in Ecosystems Services Valuation/Values C. Incorporating Ecosystems Services Valuation into Policy Making D. The Way Forward
A. Ecosystem Values Why Value Ecosystem Services ? Markets, prices and resource allocation Market failures decline in supply of ES Valuation assesses human welfare changes associated with environment quality changes or natural resource availability changes Anthropocentric, monetary values
Millennium Ecosystems Assessments
Natural Capital Loss and Degradation Issues Land degradation Trends 25% of land area in Asia-Pacific degraded (2008) 43% of agricultural land degraded in South Asia >50% of dry land ecosystems affected by desertification Overall positive trend, but.... 3.32 Mha loss (primary forests) in SE Asia (1990-2010) 15-20% of global GHG emissions from land use change & tropical deforestation. 5-6% of global emissions from deforestation in South and SE Asia. 67% reduction in species and populations in Asia-Pacific (1970-2010) Over 40% of the coral reefs and mangroves disappeared over the last 40 years declining fish stocks Forests Climate (GHG emissions) Biodiversity Coral reefs
Ecosystems and Human Wellbeing Biophysical Structure or process (e.g. vegetation cover or Net Primary Productivity Function (e.g. slow water passage, biomass) Service (e. g. Flood protection, products) Benefits (s) (contribution to health, safety, etc.) Econ (Value) (e.g. WTP for protection or products) R. S. de Groot et al, 2010
Economic value linked to forest goods and services Use value Non-use value Direct use value Indirect use value Option value Existence value Bequest value Extractive, consumptive or structural value, mainly derived for goods that can be extracted, consumed or enjoyed directly Services that the environment provides Value attached to maintaining the possibility of obtaining benefits from ecosystem goods and services at a later date, including from a low value now but could have a much higher value in future because of new information and knowledge Value people derive from the knowledge that something exists even if they never plan to use it Value derived from the desire to pass on ecosystems to future generations Material goods Regulating services All services All services Supporting services Cultural and amenity services Supporting services Source: PLS ADD APPROPRIATE SOURCE FORMAT (details in notes)
Valuation Methods Direct Market Valuation Market Prices Cost based approaches Production function based approaches Surrogate Market Valuation Travel cost, hedonic pricing Stated Preference Methods Contingent Valuation, Conjoint Analysis Benefit Transfer
Value of Global Ecosystem Services $ Trillion/year 18.1, 37% Marine Terrestrial 30.8, 63%
Values of Marine Ecosystems $ Trillion/year 12.3, 40% Open ocean Coastal 18.5, 60%
Values of Coastal Ecosystems $ Trillion/year 6, 33% 6.3, 34% Estuaries Seagrass Coral reef Shelf 0.6, 3% 5.6, 30%
Values of Terrestrial Ecosystems $ Trillion/year 0.2, 1% 2.5, 14% 6.9, 38% Forest Grassland Wetlands Lakes/Rivers Croplands 7.2, 40% 1.3, 7%
Global Annual Forest Ecosystem Services $/ha 1400 1200 1000 800 600 400 200 0
Source: Valuing forest ecosystem services: What we know and what we don't , K.N. Ninan and Makoto Inoue, 2012
Forest Ecosystem Services Valuation- Summary Values sensitive to number of services valued, price/method used, and local contexts. Total value vary between 8 4080 $/ha/year, mean 753 Values are higher for watershed protection services, carbon sequestration, waste treatment, environment purification, and pollination services
Macroeconomics: opportunity and vulnerability It is not negligible: US$ 7.5 billion in East Asia & Pacific, US$ 4 billion in South Asia US$ 6 billion in Europe & Central Asia (for 2005) It is at risk! e.g. decline in NC can really affect GDP: e.g. loss of 17-34% Kiribati from rising sea levels East Asia & Pacific 20% Wealth 50% 30% Millions of jobs and exports The Wealth of the Nations. 2005.
Cost Benefits in Policy contexts: National returns to investing are higher than the investment costs Project level ERR from sustainable management can be high (linked to type of activities, ecosystems, and their services) Amazons: $470m ($162m loan from IDB), 14.4% ERR. EbA often highly cost- effective in relation to other types of adaptation
TEEB Findings 50% reduction in deforestation rates by 2030 would reduce GHG emissions by 1.5 to 2.7 GT CO2 - US$3.7 trillion in NPV terms. Over-exploitation of fish stocks reduce the income from global marine fisheries by US$50 billion annually. Coral reefs -30 million people in coastal communities are totally reliant on reef-based resources for livelihood. Bee keeping generates US$213 million annually in Switzerland. Tree planting - 400,000 trees - US$20-67 million over the period 2008-2012 in Canberra.
Shortcomings of FEV Studies Limited coverage of forest sites, There are underserved FES in valuation studies Watersheds, soil conservation, carbon sequestration, recreation well studied Nutrient recycling, pollination, purification little attention Poor design- scale, year of the study, many methodological issues, stock/flow, data description,
Shortcomings of FEV Studies Cont.. Marginal value vs total value Inconsistent use of terminologies Disservices have not been valued No consensus on double counting Interdependencies amongst different ecosystems are not considered.
The Way Forward Valuation Studies Sound evidence (Science, Economics) Credibility Focus on underserved ES Make available studies accessible Uniformity and common approach to quality control Link to policy/project, marginal values
The Way Forward Promoting investment on natural capital Rigorous valuation combine with employment, financial and fiscal impacts data. Combine with physical infrastructure investments Combine with poverty reduction programs conditional cash transfer Mobilize private financing green business ADB s work on natural capital