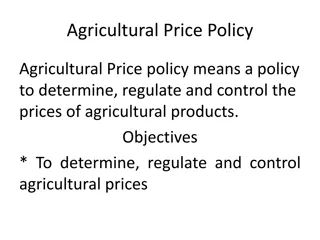
Development of Methodologically Robust Agricultural Capital Stock Statistics by FAO

In November 2015, the Food and Agriculture Organization of the United Nations (FAO) initiated a project to enhance Agricultural Capital Stock statistics, focusing on inclusive and efficient agricultural and food systems. The project involves developing methodologies for measuring capital stock and mechanization, as well as collecting, compiling, validating, and disseminating annual data estimates. Supported by various FAO Legislated Bodies, the initiative aims to improve the understanding of capital-related variables in agriculture, forestry, and fishery sectors, addressing macro-economic variables and labor factors. The project also delves into different types of assets involved in agricultural operations. Additionally, it examines the share of equipment and structures in the National Capital Stock (NCS) and Gross Fixed Capital Formation (GFCF) in the USA over several decades.

Download Presentation

Please find below an Image/Link to download the presentation.
The content on the website is provided AS IS for your information and personal use only. It may not be sold, licensed, or shared on other websites without obtaining consent from the author. Download presentation by click this link. If you encounter any issues during the download, it is possible that the publisher has removed the file from their server.
E N D
Presentation Transcript
13 November 2015, Rome Food and Agriculture Organization of the United Nations (FAO)
New work on methodologically robust Agricultural Capital Stock statistics funded by One of Five FAO Strategic Objectives (SO) for the 2014-2015 biennium : To Enable inclusive and efficient agricultural and food systems (SO4) Output/Activity required from Statistics Division: To develop and implement methodologies for the measurement of capital stock and mechanization To develop, collect/compile, validate, and disseminate data on annual capital stock estimates Work and approach supported by FAO Legislated Bodies (Committee on Agriculture, African Commission on Agricultural Statistics, Asia-Pacific Commission on Agricultural Statistics, Latin America-Caribbean-FAO Working Group on Agricultural Statistics)
a) Capital Stock related variables Agriculture, Forestry & Fishery (AFF) Total economy Agriculture (Ag) Gross fixed capital formation Net capital stock Gross capital stock Consumption of fixed capital b) Macro-economic variables not in a) c) Other labour variables (for OECD countries only) Wages and salaries, N. of employees, Self-employed, Full-time equivalents - total engaged & employees, Hours worked - total engaged & employees Value added Gross Output Operating surplus, gross Operating surplus, net Compensation of employees Employment necessary for calculating the investment ratio and capital stock supporting variables in the calculation capital stock it refers to the Gross Domestic Product (GDP)
Farm structures, including major improvements to other buildings and structures Transport equipment Machinery and equipment Communications equipment, office machinery and computers Produced intangible fixed assets, e.g. software, R&D Major improvements to tangible non-produced assets, e.g. land Livestock Trees
Share of equipment and structures in NCS and GFCF in the USA 1.0 0.9 0.8 0.7 0.6 0.5 0.4 0.3 0.2 0.1 0.0 1947 1950 1953 1956 1959 1962 1965 1968 1971 1974 1977 1980 1983 1986 1989 1992 1995 1998 2001 2004 2007 2010 Equipment-NCS Structures-NCS Equipment-Inv Structures-Inv
1. Current FAOSTAT database , with data up to 2007, based on aggregation of separate calculations of asset categories; 2. A new national-accounts based Capital Stock database.
countries item 2000 2003 2005 2007 Denmark Land Development 98.0 98.0 98.0 98.0 Denmark Livestock (Fixed Assets) 100.0 100.0 100.0 100.0 Denmark Livestock (inventory) 100.0 100.0 100.0 100.0 Denmark Machinery & Equipment 87.5 87.5 87.5 87.5 Denmark Plantation Crops 95.5 95.5 95.5 95.5 Denmark Structures for Livestock 95.5 95.5 95.5 95.5 Denmark Capital Stock + (Total) 94.8 94.8 94.9 94.9 Ecuador Land Development 98.0 98.0 98.0 98.0 Ecuador Livestock (Fixed Assets) 100.0 100.0 100.0 100.0 Ecuador Livestock (inventory) 100.0 100.0 100.0 100.0 Ecuador Machinery & Equipment 87.5 87.5 87.5 87.5 Ecuador Plantation Crops 95.5 95.5 95.5 95.5 Ecuador Structures for Livestock 95.5 95.5 95.5 95.5 Ecuador Capital Stock + (Total) 97.8 97.9 97.9 97.9
countries item 2000 2003 2005 2007 France Land Development 98.0 98.0 98.0 98.0 France Livestock (Fixed Assets) 100.0 100.0 100.0 100.0 France Livestock (inventory) 100.0 100.0 100.0 100.0 France Machinery & Equipment 87.5 87.5 87.5 87.5 France Plantation Crops 95.5 95.5 95.5 95.5 France Structures for Livestock 95.5 95.5 95.5 95.5 France Capital Stock + (Total) 93.6 93.5 93.7 93.6 Niger Land Development 98.0 98.0 98.0 98.0 Niger Livestock (Fixed Assets) 100.0 100.0 100.0 100.0 Niger Livestock (inventory) 100.0 100.0 100.0 100.0 Niger Machinery & Equipment 87.5 87.5 87.5 87.5 Niger Plantation Crops 95.5 95.5 95.5 95.5 Niger Structures for Livestock 95.5 95.5 95.5 95.5 Niger Capital Stock + (Total) 98.9 98.9 99.0 99.0
Source: FAOSTAT Sources: OECD and FAO SST Gross capital stock, millions 2005 USD Gross capital stock, millions 2005 USD GCS Gross output Value added 2005 Countries item DK/ EC DK/ EC DK/ EC Denmark Denmark Denmark Denmark Denmark Denmark Land Development Livestock (Fixed Assets) Livestock (inventory) Machinery & Equipment Plantation Crops Structures for Livestock 2,993 3,693 652 4,296 0.4 0.6 0.6 9.4 24 877 0.006 1.8 12,535 7,030 6,108 1,078 63,065 1.8 0.9 Denmark Ecuador Ecuador Ecuador Ecuador Ecuador Ecuador Capital Stock + (Total) Land Development Livestock (Fixed Assets) Livestock (inventory) Machinery & Equipment Plantation Crops Structures for Livestock 0.6 456 4,199 486 19,358 4,820 Ecuador Capital Stock + (Total) GCS for Ecuador is calculated from reported values of GFCF
Source: FAOSTAT Sources: OECD and FAO SST Gross capital stock, millions 2005 USD Gross capital stock, millions 2005 USD GCS Gross output Value added 2005 Countries item FR/ EC FR/ EC FR/ EC France France France France France France Land Development Livestock (Fixed Assets) Livestock (inventory) Machinery & Equipment Plantation Crops Structures for Livestock 19,050 18,783 3,315 40,590 3,695 10,724 96,156 7,030 6,108 1,078 2.7 3.1 3.1 89.1 0.9 22.1 227,347 17.3 13.0 France Ecuador Ecuador Ecuador Ecuador Ecuador Ecuador Capital Stock + (Total) Land Development Livestock (Fixed Assets) Livestock (inventory) Machinery & Equipment Plantation Crops Structures for Livestock 5.0 456 4,199 486 19,358 4,820 Ecuador Capital Stock + (Total)
Gross Capital Stock 2005, millions 2005 USD Net Capital Stock, millions 2005 USD FAOSTAT OECD (ISIC Rev.3:01) FAOSTAT /OECD FAOSTAT OECD (ISIC Rev.3:01) FAOSTAT/OECD 74,345 59,601 17,349 68,212 14,859 63,065 796 30,403 227,347 290,611 31,888 61,417 46,344 8,056 39,678 7,167 33,992 596 15,219 120,560 146,516 18,203 Australia Austria Belgium Canada Czech Republic Denmark Estonia Finland France Germany Hungary Iceland Ireland Israel Italy 119,275 15,412 6,912 100,954 11,852 12,535 2,171 12,265 96,156 84,125 11,370 1.6 0.3 0.4 1.5 0.8 0.2 2.7 0.4 0.4 0.3 0.4 1.0 1.0 0.5 0.2 115,979 14,017 6,623 94,596 11,133 11,897 1,987 11,101 90,052 76,597 10,766 1.9 0.3 0.8 2.4 1.6 0.4 3.3 0.7 0.7 0.5 0.6 1.2 1.8 0.7 0.4 991 754 985 898 19,766 5,020 426,349 11,104 3,208 217,319 20,470 2,421 85,127 19,573 2,316 78,328 FAOSTAT 50% of reported GCS FAOSTAT 150% of reported GCS
Gross Capital Stock 2005, millions 2005 USD Net Capital Stock, millions 2005 USD FAOSTAT OECD (ISIC Rev.3:01) FAOSTAT /OECD FAOSTAT OECD (ISIC Rev.3:01) FAOSTAT/OECD 477,191 2,071 84,645 18,079 83,994 14,691 92,978 8,285 3,729 117,695 30,878 33,961 77,269 727,166 309,337 1,027 48,290 14,612 23,597 6,976 61,129 3,127 1,450 86,362 18,808 17,208 37,062 397,855 Japan Luxembourg Netherlands Norway Poland Portugal Republic of Korea Slovakia Slovenia Spain Sweden Switzerland United Kingdom United States of America 293,689 0.6 0.2 0.1 0.5 0.9 1.0 0.2 0.8 0.8 0.7 0.5 0.3 0.6 0.8 266,445 0.9 0.4 0.2 0.6 2.9 2.0 0.3 2.0 1.8 0.9 0.7 0.5 1.2 1.5 496 445 12,057 9,157 74,080 14,785 16,332 6,513 2,861 83,135 14,662 8,535 49,011 617,633 11,591 8,345 67,304 13,976 15,318 6,249 2,588 78,239 13,656 7,945 45,891 577,252 FAOSTAT 50% of reported GCS FAOSTAT 150% of reported GCS
LAND DEVELOPMENT Land development = {(arable land) x (unit price) + (irrigated land) x (unit price)} Plantation crops = (land under permanent crop) x (unit price) AGRICULTURE MACHINERY Machinery and equipment = {(number of machinery for i) x (unit price of machinery for i) + (economically active population in agriculture) x US $35)} Where i stands for tractor, harvester & threshers and milking machine. US $ 35 has been taken from 1995 series after adjusting for price rises.
Global database on Agricultural Capital Stock and related structural statistics, Covering 223 countries and territories for 1970-2013, with supporting metadata/documentation Industrial Coverage: Total Economy; Agriculture, Forestry & Fishing (AFF), ISIC Rev.3:A+B; Agriculture (Ag) subsector, ISIC Rev.3:01 Variables Capital Stock related variables: GFCF, Net Capital Stock (NCS), Gross Capital Stock (GCS), Consumption of Fixed Capital (CFC) Other SNA variables: Value-Added , Gross Output , Gross Operating Surplus, Net Operating Surplus, Compensation of Employees , Employment Other Employment Variables (for OECD countries only): Wages and salaries, Number of employees, Number of self-employed, Full-time equivalents - total engaged, Full-time equivalents employees, Hours worked - total engaged, Hours worked employees Other indicators: Investment Ratio (IR), and Agriculture Orientation Index (AOI) necessary for calculating the investment ratio and capital stock supporting variables in the calculation capital stock
Agriculture, forestry and fishery GFCF in 2013 estimated at $363 billion globally (2005 USD), up 5% from 2012 and 50% from 2000. Gross Fixed Capital Formation in Agriculture, forestry and fishery by region, constant 2005 USD, 2000-2013 140 Africa Asia & Pacific Europe Latin America & Caribbean Northern America Other Developed 120 100 Asia showed highest level of agricultural investment in 2013, with GFCF of $131 billion (2005 USD) in 2013, surpassing Europe which led until 2008. 2005 USD (billions) 80 60 40 20 Note: Analysis begins in 2000 due to missing or unreliable data for many countries prior to 2000 0 2000 2001 2002 2003 2004 2005 2006 2007 2008 2009 2010 2011 2012 2013 *Other Developed includes Australia, Japan and New Zealand
In developed countries, the GFCF Agriculture Orientation Index (AOI) usually exceeds 1, indicating a higher level of investment in AFF relative to its share of the economy. Agricultural Orientation Index (AOI) in Agriculture, forestry and fishery by region, constant 2005 USD, 2000-2013 2.5 Africa Asia & Pacific Europe Latin America & Caribbean Northern America Other Developed 2.0 1.5 Developing countries have a GFCF Agriculture Orientation Index (AOI) less than 1, indicating a lower share of agricultural investment relative to its economic share. 1.0 0.5 0.0 2000 2001 2002 2003 2004 2005 2006 2007 2008 2009 2010 2011 2012 2013 *Other Developed includes Australia, Japan and New Zealand
1. Data Source: selection varies by country and variable UNSD: National Accounts Estimates (UNSD : NAE), Official Country Data (UNSD : OCD) OECD: Structural Analysis database (OECD-STAN), National Accounts Database (OECD-NA) World Input Output Database (WIOD) 2. Data Bridging Bridging across data series within a single data sources Bridging across ISIC revisions 3. and 4. Bridging across data sources Note: Bridging was essential to create a long time series for capital stock related variables 3. FAO Estimation/imputation Imputation/estimation missing observations in an existing series Estimations of capital stock related variables, and variables required for these estimations (Value-Added, Gross Output) Note: No estimation or imputation was conducted for other variables
INDUSTRIES COVERED ISIC Rev 3 AGRICULTURE, FORESTRY, FISHERY A+B AGRICULTURE HUNTING AND RELATED SERVICIES A01 No. of countries with data Total economy A+B A01 I. NATIONAL ACCOUNTS ESTIMATES (UNSD) GDP (current and fixed prices, LCU and $) GFCF (current and fixed prices, LCU and $) GFCF deflator GDP/capita (current prices, LCU and $) Value added ISIC Rev3: A+B (current and fixed prices, LCU and $) Value added deflator II. OFFICIAL COUNTRY DATA (UNSD) OUTPUT >200 >200 >200 >200 >200 >200 148 98 Less Intermediate consumption VALUE ADDED, GROSS 157 126 134 25 98 104 15 87 23 70 105 81 78 18 56 55 11 54 22 50 COMPENSATION OF EMPLOYEES OPERATING SURPLUS, GROSS MIXED INCOME, GROSS Less CONSUMPTION OF FIXED CAPITAL OPERATING SURPLUS, NET MIXED INCOME, NET GROSS FIXED CAPITAL FORMATION CLOSING STOCK OF FIXED ASSETS EMPLOYMENT Data for additional countries from STAN, OECD-NA and WIOD
For OECD countries , by order of preference: 1. 2. 3. 4. OECD: Structural Analysis database (OECD-STAN) OECD - National Accounts Database (OECD-NA) UNSD : Official Country Data World Input Output Database (WIOD) For all other countries, by order of preference: 1. 2. 3. UNSD : Official Country Data non-OECD countries covered in OECD-STAN and OECD-NA World Input Output Database (WIOD)
1. WHAT IS THE BRIDGING ? It is a process that connects two or more : fully specified data stores for a limited time or on an ongoing basis N.B.: Before the bridging is undertaken, we rebase the constant values using the 2005 as a base year. Moreover, only values in LCU are bridged. 2. WHY WE USE THE BRIDGING ? In order to have long data series, as data in different series / ISIC Revisions / Sources are not comparable.
3. WHEN WE USE THE BRIDGING ? i. Series-bridging This involves UNSD - Official Country Data, as data are reported in different series. Different series numbers are used to store different time-series versions of national accounts statistics, e.g. different SNA national accounts methodology, different currencies, fiscal years, or by different sources. NB: Priority is given to the most recent series ii. ISIC Revisions-bridging The present dataset reports data in ISIC Rev.3, as most of the countries still report information in ISIC Rev.3. The bridging of various revisions of ISIC involves the UNSD - Official Country Data & the OECD STAN database. If no data for a certain year is available in ISIC Rev.3, but it is available in ISIC Rev.4, then the latter will be bridged into ISIC Rev.3.
iii. The sources-bridging In order to expand the time series, different sources are bridged. How do we use the sources ? 1. OECD (STAN and National Accounts) : it is used as the primary source for OECD countries (the dbs include also some non-OECD countries, e.g. China, Brazil) NB: data from OECD-NA are in ISIC Rev.4 only - converted into ISIC Rev.3. 2. UNSD (Official Country Data) : it is usually used for non-OECD countries. 3. WIOD : it is used when no other source is available.
4. HOW THE BRIDGING IS UNDERTAKEN ? The bridging is possible only when there is overlap between at least two data for the same year. Once the two series to be bridged have been identified, we calculate their conversion factor (as a ratio of the two series): We have used the last available year or the last 3-years average, depending on the trend of the series: if the trend is more or less stable, then we assume that the last available year is sufficient, otherwise if the values varies significantly over the years, then an average has been taken. The bridging is not recommended when the two series differ significantly, e.g. when the conversion factor is greater than 1.5 or is smaller than 0.5.
Series-bridging Gross Fixed Capital Formation, ISIC Rev.3:A+B The bridging is possible No overlap Different currency Bridging not possible
a. If reported data are available only for a limited number of years : the missing years' data are imputed based on data on the most recent, or an average of the most recent, available investment ratio (GFCF/VA). b. If there are no data at all : imputation for GFCF in Ag are based on (1) value-added ratiofor Ag over AFF to GFCF in AFF; imputation for GFCF in Ag & GFCF in AFF are based on (2) regression equations (linear and logarithmic) in which the endogenous variable is the investment ratio and the exogenous variable GDP/capita. It would have been preferable to use VA/EMPL as explanatory variable but many employment series are missing or are of dubious quality. The parameters of the equation are estimated based on the data from the countries from which data are available. The R2 value of the regressions vary between 0.9 (logarithmic regression for middle and high income countries) and 0.74 (linear regression for low income countries). When reported country data on CFC are available these are used for estimating GFCF, when the latter are missing, as the averages of CFC and GFCF over a medium term period are normally of the same magnitude.
Data on Net Capital Stock (NCS), Gross Capital Stock (GCS) and Consumption of Fixed Capital (CFC) is available only for a limited number of countries (mainly OECD countries). For all other countries data have been calculated by FAO using the Double Declining Balance Method. In applying this method, assumption were made of depreciation rates which range from 0.03 to 0.08 depending on the economic level of the countries. There is large degree of arbitrary judgements in applying these deprecation rates. Hence, data should be interpreted with great care as they only might give an order of magnitude and not information about the exact level.
b) Macro-economic variables not in a) Agriculture, Forestry & Fishery (AFF) Missing data are replaced by bridged data of Value Added, UNSD-NAE. Agriculture (Ag) Value added Missing data are replaced by bridged data of Value Added, UNSD-NAE from those years when data are available. If there are no Official Country Data at all then the UNSD-NAE have been used. If there are no Official Country Data at all, then the whole data series are imputed, using UNSD-NAE for Agriculture, forestry, fishery (ISIC Rev.3:A+B) as the basis and then multiply by the value-added ratio of Agriculture (ISIC Rev.3:01) over Agriculture, forestry, fishery (ISIC Rev.3:A+B) for neighbouring countries with the same level of economic development and structure. Output Missing data in country series of Gross Output, Official Country Data, are imputed using the ratio of Gross Output/Value Added of adjacent years. Missing data points in country series of Gross Output, Official Country Data, are imputed using the ratio of Gross Output/Value Added of adjacent years. In case the data series are empty then Gross Output is estimated using the ratio of Gross Output/Value Added for neighbouring countries, with the same level of economic development and structure, applied to available data on Value added, National Accounts Estimates for Agriculture, forestry, fishery (ISIC Rev.3: A+B) In case the data series are empty then Gross Output is estimated using the ratio of Gross Output/Value Added for neighbouring countries with the same level of economic development.
The fact that a large amount of data on GFCF is imputed or estimated is not the only weakness of the database. Another weakness is that we have no information on how large share of GFCF is machinery and how large share is structures. The present database on Gross Fixed Capital Formation is a test database. The methodology and input data will continuously be improved - in particular when FAO data on machinery investment become available.
Double-declining balance method (proposed by the OECD Capital Stock Manual, the SNA 2008 and BEA) W WtE tE = = W WtB tB + I + It t (I (It t/2+W /2+WtB tB) ) = I It t (1 (1 - - /2) + /2) + W WtB tB (1 (1 ) ) WtE and WtB are the end-year and beginning-of-the year net capital stocks, It is gross fixed capital formation, (It/2+WtB) is consumption of fixed capital, is the depreciation rate =R/TA where TA is the average service life of an asset, and R is a parameter around 2. Where
A starting stock for some period t has to be computed Using capital survey information or Estimate for the long-run growth rate of volume investment when geometric age-efficiency or age-price profiles apply net stock at the beginning of the benchmark year t can approximated by Wt0= It0 / ( + ) = the long-run growth rate of volume GDP, or in our case, value added in agriculture
Depreciation rates for different groups of countries Assumed growth rates for the initial capital stock Deflators Imputations when there are missing data and when there are no data at all Stability of bridging data series (Rev 4 to Rev 3 and between different sources) How to get reliable data on GFCF in agriculture machinery (the instability of COMTRADE and PRODCOM data)


 Capital Stock related variables")
 Capital Stock related variables")


, Gross Capital Stock (GCS)")
 Macro-economic variables not in a)")