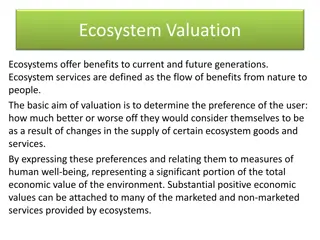
Social Anchoring and Hypothetical Bias in Valuation of Environmental Goods
Using a payment card experiment, this study examines social anchoring and hypothetical bias in willingness to pay for transitioning to extensive farming. Treatments include control, social anchoring with feedback, and hypothetical bias with cheap talk script. Data collection involved over 400 respondents for each treatment, revealing insights on donation behavior and valuation methods. The study also touches on problems with using donations as a payment vehicle and evidence of anchoring effects in valuation experiments.

Download Presentation

Please find below an Image/Link to download the presentation.
The content on the website is provided AS IS for your information and personal use only. It may not be sold, licensed, or shared on other websites without obtaining consent from the author. Download presentation by click this link. If you encounter any issues during the download, it is possible that the publisher has removed the file from their server.
E N D
Presentation Transcript
Study Social anchoring and hypothetical bias in stated WTP Mark Koetse1, Jetske Bouma2 1 Institute for Environmental Studies (IVM), VU University Amsterdam 2 PBL Netherlands Environmental Assessment Agency, Den Haag 23rd EAERE conference, Athens, 29 June 1 July 2017 1
CV experiment One-time donation to a fund that stimulates a transition from intensive to extensive farming, using a payment card Description of the two types of farming (increased water levels an no use of pesticides for non- intensive farming) Description of biodiversity benefits of non-intensive farming 2
CV experiment Description of landscape changes Intensive farming Non-intensive farming 3
Treatments T1 (control): hypothetical donations, no feedback on expectations T2 (social anchoring): hypothetical donations, feedback on expectations 1 T3 (social anchoring): hypothetical donations, feedback on expectations 2 T4 (hypothetical bias): hypothetical donations, cheap talk script T5 (hypothetical bias): real donations 4
Data collection Respondents from TNS-NIPO online panel (200,000 households) Independent identical sampling procedure for each treatment Response rate around 45% for hypothetical treatments, around 18% for actual donation treatment 400+ useable respondents for each treatment 5
Social anchoring in donating to a public environmental good Mark Koetse1, Jetske Bouma2, Dominic Hauck1 1 Institute for Environmental Studies (IVM), VU University Amsterdam 2 PBL Netherlands Environmental Assessment Agency 23rd EAERE conference, Athens, 29 June 1 July 2017
Problem Contingent valuation and choice experiments often used for valuation of public environmental goods Donations often used as the payment vehicle Possible problems with using donations: Free riding and inequality aversion (Kotchen, 2015) Dependence on other people s behaviour does not correspond to theoretical concept of WTP as individual assessment of value Evidence of anchoring: e.g. Carlsson et al. (2010); Shang and Croson (2009) 7
Theoretical background: Free riding vs. inequality aversion We argue that many different types of behaviour, such as conditional cooperation and reciprocity, can be modelled as inequality aversion. Inequality aversion model by Fehr & Schmidt (1999) as starting point: n n ( ) = max ,0 max ,0 U x x x x x x 0 0 0 i i n n = = 1 1 i i Inequality aversion (in original version): - People dislike having more/less than others - Dislike having less > dislike having more 8
Theoretical background: Free riding vs. inequality aversion Donations to public good, two possible effects of other people s behaviour: ( ) ( ) = + + , ,0 ,0 U d d d v d d max d d max d d i i i i i i i i i n n i i i Free riding Inequality aversion When incentive to free ride increases with total donations, there are opposing effects of other people s donations on one s own donation: 1. Increased donations by others imply more free riding and a lower donation. 2. Increased donations by others imply a higher donation through inequality aversion. 9
Theoretical background: Free riding vs. inequality aversion Donations of others generally unknown Expectations used as substitute Although entire distribution may be relevant, we test the impact of expectations on the mean: ( ) on i ( ) ( ) ( ) ( ) = + , , E ,0 E , 0 U d d d v d E d max d d max d d i i i i i i i i i i Free riding Inequality aver s 10
Hypotheses Inequality aversion dominates free riding (based on experimental literature) H1: Increase in expectations about donations of others increases donations H2: Donations increase when expectations were too low, decrease when expectations were too high Dislike donating more > dislike donating les H3: Adjustments in donations are larger for over- than for under- estimations 11
Research design Measuring people s expectations (before donation question, all treatments): Prior to this study we asked a large amount of households how much they would be willing to donate once to the fund discussed before. We would like to know your assessment of the results of this study. How many percent of the households do you think were willing to contribute to the fund? % What do you think was the average donation in Euro of households that were willing to donate to the fund? Euro 12
Research design Three treatments T1 (control): hypothetical donations, no feedback on expectations T2 (social anchoring): hypothetical donations, feedback on share of donating households T3 (social anchoring): hypothetical donations, feedback on share of donating households AND average donation of donating household 13
Research design Feedback text: The actual study results were as follows: Percentage of donating households: 25% This means your percentage assessment was 5% LOWER/HIGHER than the actual percentage. Average donation of a donating household: 15 Euro This means your donation assessment was 5 Euro HIGHER than the actual donation. 14
Results: treatments effects on donations Mean shares of donating households Split sample: people with expectations below and above the true share (25%) Expectations: Share of donating households a Treatment Full sample < 25% >= 25% 0.529 0.425 0.656 t1: control 0.548 0.451 0.657 t2 0.527 0.434 0.649 t3 15
Results: treatments effects on donations Full sample Expectations< 15 Expectations >= 15 Mean donation Mean donation DH Mean donation Mean Mean donation Mean donation DH donation DH t1: control 10.0 ( 17.0) 19.0 ( 19.5) 4.38 ( 9.06) 9.35 ( 11.4) 17.9 ( 21.8) 29.2 ( 21.1) t2 11.0 ( 27.1) 20.0 ( 34.1) 4.65 ( 7.83) 9.52 ( 8.91) 18.8 ( 38.3) 30.2 ( 44.9) t3 10.8 ( 21.3) 20.6 ( 25.8) 3.77 ( 5.96) 8.75 ( 6.23) 19.7 ( 29.0) 30.4 ( 31.2) Slight decrease for people with low expectations Substantial increase for people with high expectations Slight increase overall 16
Results: Expectations and the decision to donate Logit model: donation vs. no donation Sample: Expectations < 25% t1 t2 -1.48*** -0.762*** -0.769*** -0.650 Sample: Expectations >=25% t1 t2 -0.494 t3 t3 -0.868* Constant 0.101*** 0.050*** 0.046** 0.033*** 0.030*** 0.038*** Expectations: share of donating households NOBS 266 0.073 246 0.021 251 0.016 218 0.030 219 0.026 191 0.043 Adjusted pseudo R2 Increased expectations on share of donating households increases the probability of donating Feedback on actual share of donating households substantially changes the relationship for people with too low expectations 17
Results: Expectations and the decision to donate More free- riding More Matching 18
Results Poe et al. (2005) combinatorial test on differences between Logit slope coefficients Also for model with covariates for robustness (income, education, age, gender, household size, political preference, distance decay, expectations average donation) Logit Expectations < realisation t1 > t2 t1 > t3 Expectations >= realisation t1 > t2 t1 > t3 t2 > t3 t2 > t3 Model without covariates 0.035** 0.025** 0.444 0.431 0.398 0.339 Model with covariates 0.020** 0.025** 0.478 0.466 0.317 0.347 19
Results: Expectations and donations OLS: Donation amount (excluding Donation = 0) Sample: Expectations < 15 t1 t2 -0.433 1.19 Sample: Expectations >= 15 t1 t2 15.8*** 14.7** t3 3.32** t3 11.5** Constant 1.28*** 1.12*** 0.716*** 0.337*** 0.360** 0.463*** Expectation: donation of donating household NOBS 132 0.111 126 0.144 106 0.113 124 0.164 129 0.038 127 0.140 Adjusted R2 Increased expectations on average donations increases the Donation amount Feedback on actual share of donating households substantially changes the relationship 20
Results: Expectations and donations More free- riding More Matching 21
Results: Robustness Poe et al. (2005) combinatorial test on differences between OLS slope coefficients OLS Expectations < realisation t3 < t1 t3 < t2 Expectations > realisation t3 < t1 t3 < t2 t2 < t1 t2 < t1 Model without covariates 0.054* 0.089* 0.331 0.149 0.283 0.436 Model with covariates 0.039** 0.132 0.209 0.096* 0.131 0.390 22
Conclusions H1: Increased expectations about donations of others increases donations: inequality aversion dominates free riding Our results confirm this to a large extent: expectations increase donations Donation amount Tendency to match stronger for people with low expectations More free riding in sample of people with high expectations 23
Conclusions H2: Donations increase when expectations were too low, donations decrease when expectations were too high Treatments averages suggest that results are exactly opposite to our hypothesis Donation decision Expectations too low: Adjustment towards matching instead of overmatching Donation amount Expectations too low: No clear interpretation in terms of FR vs. IA Expectations too high: Adjustment towards matching 24
Conclusions H3: Adjustments in donations are larger for over- than for under- estimations (dislike donating more > dislike donating less) Some evidence of opposite, i.e., larger adjustments for underestimations, especially for decision to donate 25
Discussion Valuation Using donations in contingent valuation is problematic because of the influence of expectations on other people s behaviour Further research: How problematic is this? 26
Discussion Financing Interesting findings for financing nature, e.g. through crowdfunding: donations may be affected by changing expectations on what other people donate/invest, and by providing information on this issue Further research: Our study is on expectations on averages for the entire population: people may anchor to different groups in society (Chen & Li, 2009) and to different moments of the distribution (Shang & Croson, 2009) 27
References Carlsson F, JH Garc a, A L fgren, 2010, Conformity and the Demand for Environmental Goods, Environmental and Resource Economics 47, 407 421. Chen Y, SX Li, 2009, Group Identity and Social Preferences, American Economic Review99, 431 457. Fehr E, KM Schmidt, 1999, A Theory of Fairness, Competition, and Cooperation, Quarterly journal of Economics114, 817 868. Kotchen MJ, 2015, Reconsidering Donations for Nonmarket Valuation, Environmental and Resource Economics62, 481 490. Shang J, R Croson, 2009, A Field Experiment in Charitable Contribution: The Impact of Social Information on the Voluntary Provision of Public Goods, The Economic Journal119, 1422 1439. 28