Understanding the Impact of Unemployment on Wellbeing: A European Study
Studies reveal that the unemployed experience lower happiness levels, poorer mental health, reduced wellbeing, and loss of self-esteem compared to the employed. This investigation examines the relationship between personal and social wellbeing and employment status using data from the 2012 European Social Survey in Hungary, Spain, and the United Kingdom. The analysis focuses on key dimensions of wellbeing and definitions of employed, unemployed, and economically inactive individuals.

Download Presentation

Please find below an Image/Link to download the presentation.
The content on the website is provided AS IS for your information and personal use only. It may not be sold, licensed, or shared on other websites without obtaining consent from the author. Download presentation by click this link. If you encounter any issues during the download, it is possible that the publisher has removed the file from their server.
E N D
Presentation Transcript
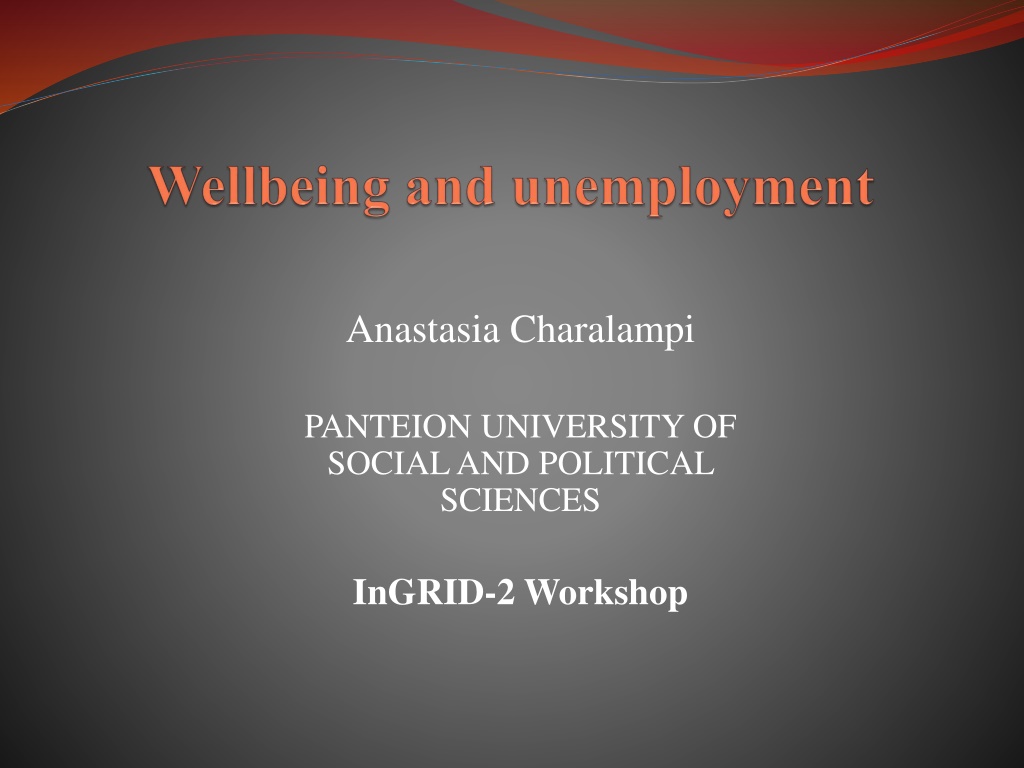
Anastasia Charalampi PANTEION UNIVERSITY OF SOCIAL AND POLITICAL SCIENCES InGRID-2 Workshop
INTRODUCTION Studies conducted at both the aggregate and individual levels reveal that the unemployed - are relatively unhappy - suffer from poorer mental health - show reduced psychological and physical wellbeing, and - (most commonly) show loss of self-esteem compared to their employed counterparts
We investigate the association between the 2012 European Social Survey (ESS) measurement of personal and social wellbeing and the respondent s status as unemployed or employed The analysis is based on the ESS datasets of Hungary, Spain and the United Kingdom
ESS Round 3 (2006) included a module on personal and social wellbeing, repeated with certain changes in Round 6 (2012) Six key dimensions of wellbeing combination of theoretical models and statistical analyses: o Evaluative wellbeing o Emotional wellbeing o Functioning o Vitality o Community wellbeing o Supportive relationships
The European Union Labour Force Survey (EU- LFS) adopts the conventional definitions of the International Labour Organization (ILO) for employed, unemployed and economically inactive persons: Employed are all persons aged 15 years and over who, during the reference week, performed work - even for just one hour - for pay, profit or family gain, and those persons who were not at work that week but had a job or business from which they were temporarily absent because of illness, holiday, industrial dispute or education and training
Unemployed are persons aged 15 to 74 who were: (a) without work during the reference week, i.e. neither had a job nor were at work (for one hour or more) in paid employment or self- employment; AND (b) currently available for work, i.e. were available for paid employment or self- employment before the end of the two weeks following the reference week; AND (c) actively seeking work, i.e. had taken specific steps in the four-week period ending with the reference week to seek paid employment or self- employment, or who had found a job to start later, i.e. within a period of at most three months. Inactive are those classified as neither employed nor unemployed
METHOD For the measurement of wellbeing: Each country s sample was randomly split into two halves. Exploratory Factor Analysis (EFA) was performed on the first half in order to assess the construct validity of the scale The structure suggested by EFA was validated by carrying out Confirmatory Factor Analysis (CFA) on the second half The subscales were constructed for the full sample by averaging their rescaled defining items based on their factor loadings
Six subscales of wellbeing were defined for Hungary: emotional wellbeing, vitality, specific functioning, general functioning, community wellbeing and supportive relationships Four subscales of wellbeing were defined for Spain and the UK: emotional wellbeing positive, emotional wellbeing negative, specific functioning and general functioning
In the ESS questionnaire, a perception question determines the respondent s employment status in the reference period (the last seven days) The employment status was re-coded as: a) employed, those in paid work , b) unemployed, those declaring that they were unemployed and actively looking for a job and unemployed, wanting a job but not actively looking for a job and c) inactive, those not classified as employed or unemployed
Table 1 Respondent s Employment Status: European Social Survey in paid work (or away temporarily) (employee, self-employed, 01 working for your family business) in education, (not paid for by employer) even if on vacation 02 unemployed and actively looking for a job 03 unemployed, wanting a job but not actively looking for a job 04 permanently sick or disabled 05 retired 06 in community or military service 07 doing housework, looking after children or other persons 08 Other 09 Don t know 88 Reproduced from ESS Round 6 source questionnaire, by European Social Survey, 2012, p. 44.
K-means clustering (k=5) was performed in order to transform the raw scores into a 1-5 scale Cross-tabulations were constructed so as to indicate the cut-off points for recoding the subscale scores To investigate the association - cross-tabulations and chi-square tests Significance p<0.001 - we could proceed to the comparison of the mean values
RESULTS In all cases tested, the scores on the wellbeing subscales of the unemployed differed significantly (p<.001) from those of the employed, with the unemployed scoring systematically lower than the employed
60 50 40 30 1 2 3 4 5 20 10 0 Unemployed Unemployed Unemployed Unemployed Unemployed Unemployed Employed Employed Employed Employed Employed Employed Emotional wellbeing Vitality Functioning (specific) Functioning (general) Community wellbeing Supportive relationships Fig. 1: The wellbeing subscales among the unemployed and employed: Hungary, European Social Survey, 2012
60 50 40 30 1 2 3 4 5 20 10 0 Employed Unemployed Unemployed Unemployed Unemployed Employed Employed Employed Emotional wellbeing (-) Functioning (specific) Emotional wellbeing (+) Functioning (general) Fig. 2: The wellbeing subscales among the unemployed and employed: Spain, European Social Survey, 2012
70 60 50 40 1 2 3 4 5 30 20 10 0 Employed Employed Employed Employed Unemployed Unemployed Unemployed Unemployed Emotional wellbeing (+) Emotional wellbeing (-) Functioning (specific) Functioning (general) Fig. 3: The wellbeing subscales among the unemployed and employed: United Kingdom, European Social Survey, 2012
Emotional WB Emotional WB 4 5 4 3 Supportive Relat. Supportive Relat. 3 Vitality Vitality 2 2 1 1 0 0 Community WB Funct. Specific Community WB Funct. Specific Funct. General Funct. General Unemployed Employed Fig. 4: Mean scores on the wellbeing subscales among the employed and unemployed: Hungary, European Social Survey 2012
4.5 4 3.5 3 2.5 2 Unemployed Employed 1.5 1 0.5 0 Fig. 5: Mean scores on the wellbeing subscales among the unemployed and employed: Hungary, European Social Survey 2012
Emotional WB (-) Emotional WB (-) 5 5 4 4 3 3 2 2 1 1 Funct. General Funct. Specific Funct. General Funct. Specific 0 0 Emotional WB (+) Emotional WB (+) Unemployed Employed Fig. 6: Mean scores on the wellbeing subscales among the employed and unemployed: Spain, European Social Survey 2012
5 4.5 4 3.5 3 2.5 Unemployed 2 Employed 1.5 1 0.5 0 Emotional WB (-) Funct. Specific Emotional WB (+) Funct. General Fig. 7: Mean scores on the wellbeing subscales among the unemployed and employed: Spain, European Social Survey 2012
Emotional WB (+) Emotional WB (+) 5 5 4 4 3 3 2 2 1 1 Funct. general Emotional WB (-) Funct. general Emotional WB (-) 0 0 Funct. specific Funct. specific Employed Unemployed Fig. 8: Mean scores on the wellbeing subscales among the employed and unemployed: United Kingdom, European Social Survey 2012
5 4.5 4 3.5 3 2.5 Unemployed 2 Employed 1.5 1 0.5 0 Emotional WB (+) Emotional WB (-) Funct. specific Funct. general Fig. 9: Mean scores on the wellbeing subscales among the unemployed and employed: United Kingdom, European Social Survey 2012
CONCLUSIONS On all wellbeing subscales, in all three countries, the mean scores of the unemployed were significantly lower than those of the employed, confirming relevant results and theory Although, as we have mentioned in previous work, the same labels have been used for the definition of the subscales, it should be noted that these were defined by different items among countries
This methodological study contributes to the research on wellbeing and unemployment providing evidence based on a new measurement of wellbeing that has been proposed in the ESS However, it should be noted that the above differences between employed and unemployed were not found when these analyses were conducted for other datasets (Belgium, Denmark, Finland, France, Germany, Ireland, the Netherlands, Norway, Poland, Portugal, Slovenia, Sweden and Switzerland) - further research is necessary
REFERENCES Charalampi, A. (2018). The importance of items level of measurement in investigating the structure and assessing the psychometric properties of multidimensional constructs (Doctoral dissertation). Panteion University of Social and Political Sciences, Athens Charalampi, A., Michalopoulou, C., & Richardson, C. (2018). Validation of the 2012 European Social Survey measurement of wellbeing in seventeen European countries. Applied Research in Quality of Life.Advance online publication. doi: 10.1007/s11482-018-9666-4 Cole, K. (2006). Wellbeing, psychological capital, and unemployment: an integrated theory. Paper presented at the joint annual conference of the International Association for Research in Economic Psychology (IAREP) and the Society for the Advancement of Behavioural Economics (SABE), 5 8 July, Paris. European Social Survey (2015). Measuring and reporting on Europeans wellbeing: Findings from the European Social Survey. London: ESS ERIC. Michalopoulou, C., & Symeonaki, M. (2017). Impoving Likert scale raw scores interpretability with k-means clustering. Bulletin de M thodologie Sociologique, 135, 101-109. doi: 10.1177/0759106317710863 Yfanti, A. (2019). The impact of definitions to the measurement of unemployment: Evidence from the EU-LFS 2008-2015 (Doctoral dissertation). Panteion University of Social and Political Sciences Athens.


 included a module on")


 was performed in order")