Evaluation of OMPS Sensor and EV SDR Performance by NASA
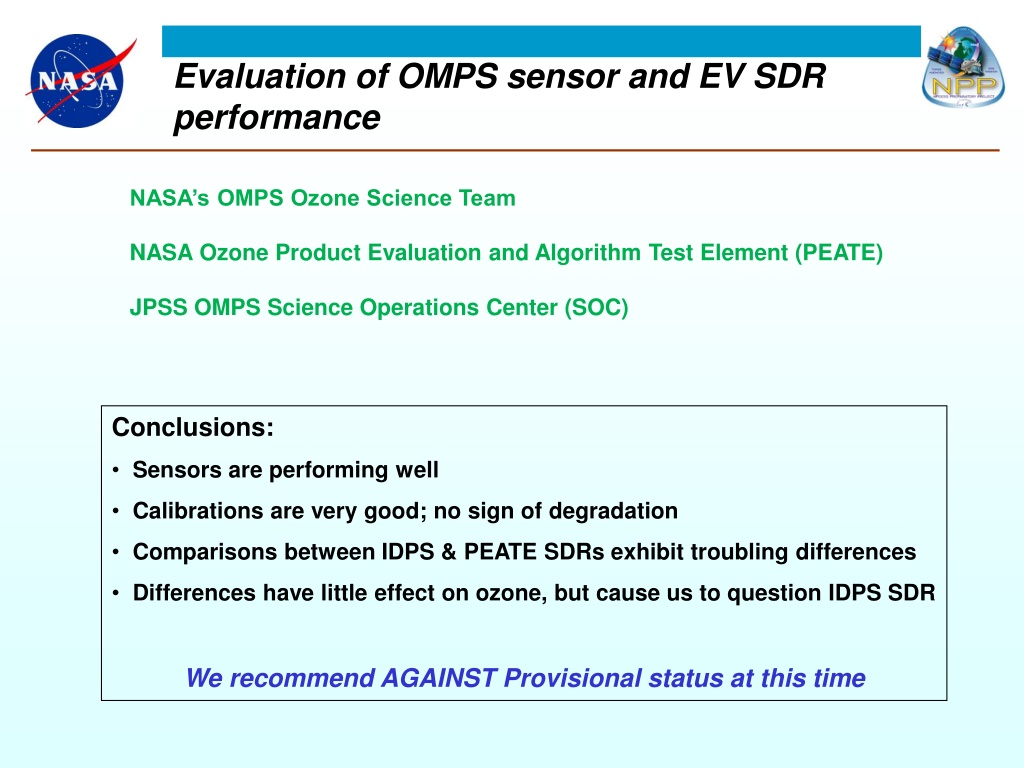
NASA's OMPS Ozone Science Team conducted an evaluation of the OMPS sensor and EV SDR performance, concluding that the sensors are performing well with good calibrations and no signs of degradation. There were troubling differences between the IDPS and PEATE SDRs, leading to a recommendation against provisional status. Various aspects such as dark currents, sensor linearity, and solar measurements were analyzed, showing stable performance and accuracy adjustments. The colocation of TC and NP was deemed reasonably good based on OMPS Swath Coverage.

Download Presentation

Please find below an Image/Link to download the presentation.
The content on the website is provided AS IS for your information and personal use only. It may not be sold, licensed, or shared on other websites without obtaining consent from the author. Download presentation by click this link. If you encounter any issues during the download, it is possible that the publisher has removed the file from their server.
E N D
Presentation Transcript
Evaluation of OMPS sensor and EV SDR performance NASA s OMPS Ozone Science Team NASA Ozone Product Evaluation and Algorithm Test Element (PEATE) JPSS OMPS Science Operations Center (SOC) Conclusions: Sensors are performing well Calibrations are very good; no sign of degradation Comparisons between IDPS & PEATE SDRs exhibit troubling differences Differences have little effect on ozone, but cause us to question IDPS SDR We recommend AGAINST Provisional status at this time
Increasing dark currents, as expected Total Column A hot pixel is any pixel with a statistically significant increase in dark current since launch Nadir Profiler
Sensor linearity is stable NP Linearity Measurement regression residuals Orbits 230 - 1166 Knowledge spec. is 0.2% over the full dynamic range Qideal / 1000 Full well
Solar measurements show no evidence of sensor change Neither Nadir sensor has exhibited signs of degradation since first light measurements in January, 2012 except possibly at the very shortest wavelengths. Results also indicate that seasonally dependent sensor response corrections are very accurate.
TC & NP wavelengths have been adjusted using measured solar spectra OMPS NP Measured Reference Spectrum The wavelength registration is derived by comparison with a synthetic solar spectrum based on ATLAS SUSIM and Kitt Peak (also used for Aura/OMI). Wavelength (nm) Shift results suggest an accuracy of ~1/100 pixel. OMPS TC Measured Reference Spectrum Wavelength (nm)
Solar spectra compare well with previous extraterrestrial measurements OMPS Day 1 Solar Flux compared to synthetic spectrum after wavelength shift 1.06 1.04 1.02 OMI comparison to same synthetic spectrum 1.00 measured / synth flux 0.98 0.96 0.94 Nadir Profiler 0.92 Nadir Mapper 0.90 0.88 0.86 250 300 350 400 Wavelength [nm]
Colocation of TC & NP is reasonably good OMPS Swath Coverage on VIIRS Image (yellow=TC, red=NP) Nadir Mapper (TC) TOA Refl. 310.70 nm Band (33) Nadir Profiler (NP) TOA Refl. 310.73 nm Band (35) OMPS EV_COLOC Orbit 1616 over Western Australia on 2/19/2012
OMPS TC comparison with modeled TOA reflectances is quite good Co-locate MLS temperature, ozone profiles to OMPS TC measurements Reflectivity < 0.10 -10 < latitude < 10 degrees June 2012 Stray light Percent reflectance difference (meas calc) Calculate TOA reflectances (radiance / solar flux) from TC viewing conditions, MLS profiles using radiative transfer code (TOMRAD) Position 19 (nadir looking) Structure seen in spectrum repeats in all swath positions, taken out through dividing by position 18 (Raman scattering) Compare measured OMPS TC reflectance with calculated reflectance Agreement seen to within 1% for wavelengths > 312 nm Stray light seen for wavelengths < 312 nm Consistent with pre-launch sensor characterization Position 19 / Position 18 Wavelength (nm)
OMPS TC cross-track calibration is typical Position 1 / Position 18 Position 4 / Position 18 Difference indicates inconsistency with MLS ozone profile, will lead to different total column ozone amounts Percent NR difference (meas calc) Problems at the far off-nadir positions lead to swath dependent ozone effects Difference indicates calibration issue Position 36 / Position 18 Position 33 / Position 18 Difference indicates inconsistency with MLS ozone profile, will lead to different total column ozone amounts Not unusual Difference indicates calibration issue Wavelength (nm)
NP stray light appears as expected Pre-launch stray light model applied to real data Orb 2840 Model estimate Measurement + Radiance / cos(SolZA) + + + + + SBUV2 technique for stray light evaluation applied to NP Errors in 1 mb O3 could be 5% or more 331 nm Reflectivity
TC stray light can be corrected NP / TC Radiance Ratio Assume NP radiances contain no stray light in the overlap region (300 310 nm) Orbit 2840 No Correction Basic Correction Use TC / NP comparison to tune ghost Basic Correction + various ghost models Best result yields 5% residual errors at 300 nm (except at high SolZA) TC Stray Light is partly caused by a ghost from 417 nm not well characterized pre-launch
OMPS Operations The OMPS SOC utilizes the NASA Cal. SDR product to maintain Flight and Ground calibrations IDPS C3S OMPS RDRs Fast Track & Diag. Flight Tables NGAS SD3E LUTs Flight calibration operations were modified after launch to optimize measurements OMPS Science Operations Center NASA Cal. SDR O3 PEATE Analysis Results
OMPS SOC delivers Cal. tables Table Description Table Type Delivery Status TC & NP Day 1 Solar LUT Once (repeat is TBD) TC & NP Wavelength GND-PI Monthly (ceased with Mx6.3) TC & NP CF Earth GND-PI Monthly (ceased with Mx6.3) TC & NP Dark Tables GND-PI In test Diagnostic Flight Sample Tables SCT Frequently Earth-view Flight Sample Tables SCT Once Earth-view Ground Sample Tables GND-PI Once Calibration Flight Sample Tables SCT Once TC & NP Radiometric Coefficients LUT TBD TC Stray Light Coefficients LUT In test NP Stray Light Coefficients LUT Not planned TC & NP Linearity (Flight & Ground) SCT/GND-PI Not planned TC & NP Flat Field SCT Not planned
Flight calibrations modified after launch 3orb Solar Every 2nd week EVNCAL 1 orbit Every week Modified Original TC Solar (1,4,7) 57 images TC Solar (1-4) 12 images Orbit 1 TC / NP Stor. Darks 37 images NP Solar 9 images TC Solar 2 16 images TC Solar (5-7) 9 images NP Solar 16 images Orbit 2 NP FF Lamp 1 image TC Solar 6 16 images NP Linearity 83 images TC / NP Open Darks 37 images NP FF Dark 1 image TC Solar (1,3,5,7) 54 images NP Dark coadd 1 image Orbit 3 TC / NP Closed Darks 37 images TC FF Lamp 1 image TC Linearity 83 images EV_4WK_DC 1 orbit Every 4th week EVLED_Closed 1 orbit Every 4th week TC FF Dark 1 image TC Dark coadd 1 image NP Lamp Warmup 50 images TC / NP Closed Darks 21 images NP Linearity 83 images TC / NP Stor. Darks 9 images NP FF Lamp 1 image TC / NP Closed Darks 5 images TC Lamp Warmup 50 images TC Linearity 83 images TC FF Lamp 1 image
Updated dark calibration sequence Original dark sequence was not optimized for transient removal Before transient removal Dark Correction for 7.5 sec TC Image (row by row mean) PEATE / SOC Darks Original Cal. Darks After transient removal We do not currently understand this small dark current difference
Solar noise driven by diffuser features NP Working Diffuser ratio: Aug. 31 / Mar. 21 =18.95 / =18.95 NP of ratio to Mar. 21 (%) Solar Angle (degrees) NP Working Diffuser ratio: Jun. 27 / Mar. 21 =14.57 / =18.95 TC
Special solar data resampled to study diffuser feature reduction 3-image running aggregation Solar sequence lengthened to reduce noise from diffuser features Original solar sequence New solar sequence: ~ 80 sec 12-image running aggregation Original solar sequence
NASA evaluation of IDPS OMPS SDR What does the SDR do? Radiance = [ Raw Counts Bias Smear Dark StrayLight ] x Cal. Consts. Not Problems OK? OK Problems implemented Smear, Dark, and StrayLight are small corrections, so radiance errors are small But . we believe this evaluation is about establishing confidence in SDR Some problems have clear resolutions For others the cause is still under investigation EV SDR not understood well enough for Provisional
Transients in smear region not corrected Derived Radiance (right side) Smear is the only correction derived directly from Earth scene data Smear Signal These data are doors- closed, so radiances should be zero Derived Radiance (left side) Will result in significant radiance errors over entire swath (primarily in SAA)
Smear values (reported as used in SDR) don t appear to be correct PEATE SDR Swath corresponding to 12 Oct 2012 5 hr, 52 min, 2.82 sec smear Bias Floor Wavelength Index IDPS SDR Do not understand how these values come about given the existing co-add and binning characteristics smear Wavelength Index
Calibration constants not appropriate for current stray light correction IDPS SDR uses radiance conversion coefficients that already assume that a stray light correction has already been applied to the radiances No such correction has yet been applied FOV 16 IDPS PEATE IDPS / PEATE RadCoef SLcor / RadCoef NOcor
Code doesnt properly deal with SAA corrections IDPS PEATE Smear values used by SDR are all negative within the SAA SDR code currently uses a special Dark subtraction within the SAA OMPS doesn t produce negative numbers
Special dark table generated to study interpretation by EV SDR code G-ADA SDR run DarkCurrentEarth SOC provided Darks GND-PI table Test confirms that the EV SDR assigns darks to pixels the same way the SOC does when creating the Dark GND-PI table
Special test designed so that only dark counts show up in radiance output Observed Darks in radiance output Expected Darks in radiance output We recently discovered that the test was ill-posed for testing darks. But these results are consistent with a smear problem.
Shameless website plug http://ozoneaq.gsfc.nasa.gov/omps
Calibration adjustments applied to PEATE products Mapper Cross-track Calibration Nadir Calibration Error Nadir Mapper Nadir Profiler Reference wavelength s Radiative transfer calculation error ? The accuracy of the Nadir Mapper and Profiler calibration was assessed by comparing measurements with radiative transfer model calculations for top-of-the-atmosphere reflectance. These calculations are based on coincident ozone profile retrievals from the NOAA-18 SBUV2 instrument.
Radiance difference divided by Radiance coefficient Expected Darks4 Observed Darks4 The left slide is same as that in previous slide but plotted with the same axis scales on the right


")