Analysis of Course Sections Overfilled in Spring and Fall 2013
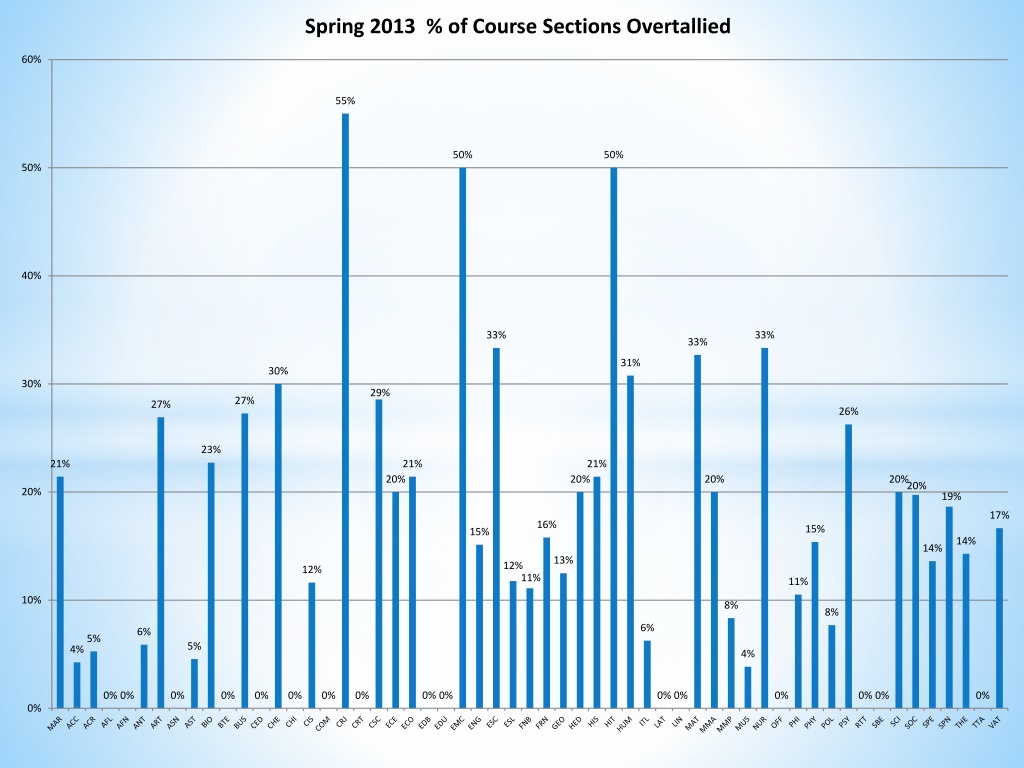
Analysis of the percentage of course sections overfilled in Spring and Fall 2013 shows a range of rates across various subjects. Spring 2013 had a higher percentage of overfilled course sections compared to Fall 2013. The comparison between Spring and Fall 2013 courses indicates notable disparities in overfilled sections across different subjects. Additionally, the number of total seats available in each subject varied between the two seasons, with some subjects having more availability than others.

Download Presentation

Please find below an Image/Link to download the presentation.
The content on the website is provided AS IS for your information and personal use only. It may not be sold, licensed, or shared on other websites without obtaining consent from the author. Download presentation by click this link. If you encounter any issues during the download, it is possible that the publisher has removed the file from their server.
E N D
Presentation Transcript
Spring 2013 % of Course Sections Overtallied 60% 55% 50% 50% 50% 40% 33% 33% 33% 31% 30% 30% 29% 27% 27% 26% 23% 21% 21% 21% 20% 20% 20% 20%20% 20% 19% 17% 16% 15% 15% 14% 14% 13% 12% 12% 11% 11% 10% 8% 8% 6% 6% 5% 5% 4% 4% 0% 0% 0% 0% 0% 0% 0% 0% 0% 0% 0% 0% 0% 0% 0% 0% 0%
Fall 2013 % of Course Sections Overtallied 30% 26% 25% 20% 18% 17% 17% 17% 16% 14% 15% 12% 11% 11% 11% 9% 10% 10% 8% 7% 7% 7% 6% 6%6% 5% 4% 5% 4% 4% 4% 3% 3% 3% 3% 2% 2% 2% 0% 0% 0% 0% 0% 0% 0% 0% 0% 0% 0% 0% 0% 0% 0% 0% 0% 0% 0% 0% 0% 0% 0% 0% 0%
Compare Spring 2013 / Fall 2013 % of Course Sections (A F) Overtallied 60% 55% 50% 50% 40% 33% 30% 30% 27% 27% 23% 21% 20% 20% 17% 17% 16% 16% 15% 12% 12% 11% 11% 11% 10% 9% 10% 8% 7% 6% 5% 5% 5% 4% 4% 3% 3% 2% 2% 0% 0% 0% 0% 0% 0% 0% 0% ACC ACR ANT ART AST BIO BUS CHE CHI CIS COM CRJ ECE ECO EMC ENG ESC ESL FNB FRN
Compare Spring 2013 / Fall 2013 % of Course Sections (G - Z) Overtallied 60% 50% 50% 40% 33% 33% 31% 30% 26% 26% 21% 21% 20% 20% 20% 20% 20% 19% 18% 17% 17% 15% 14% 14% 14% 13% 12% 11% 11% 10% 8% 8% 7% 7% 6% 6% 6% 4% 4% 4% 4% 3% 3% 2% 0% 0% 0% 0% 0% 0% 0% GEO HED HIS HIT HUM ITL MAR MAT MMA MMP MUS NUR PHI PHY POL PSY SCI SOC SPE SPN THE VAT
Spring 2013 # of Total Seats by Subject Overtallied 394 400 350 300 250 200 150 128 100 92 77 59 41 50 33 29 26 21 21 19 18 17 17 14 13 12 10 9 9 9 6 6 5 4 4 4 3 3 3 2 2 2 1 1 1 1 1 1 1 0
Fall 2013 # of Total Seats by Subject Overtallied 160 141 140 120 100 80 60 40 24 18 20 14 13 12 12 11 8 8 7 7 7 7 5 5 4 4 3 3 3 3 3 2 2 2 2 2 1 1 1 1 1 1 0
Compare Spring 2013 / Fall 2013 # Total Seats by Subject (A - F) Overtallied 140 128 120 100 77 80 60 41 40 21 21 19 18 17 20 14 12 11 10 9 8 7 7 7 6 6 5 5 5 4 3 3 3 3 2 2 2 1 1 1 1 0 0 0 0 0 0 0 ACC ACR ART AST BIO BUS CHE CHI CIS COM CRJ CSC ECE ECO EMC ENG ESC ESL FNB FRN
Compare Spring 2013 / Fall 2013 # Total Seats by Subject (G - Z) Overtallied 450 394 400 350 300 250 200 141 150 92 100 59 50 33 29 26 24 14 18 17 13 13 12 12 9 9 8 7 4 4 4 4 3 3 3 3 2 2 2 2 2 1 1 1 1 1 1 1 1 0 0 0 0 0 0 0 GEO HED HIS HIT HUM ITL MAR MAT MES MMA MMP MUS NUR PHI PHY POL PSY SCI SOC SPE SPN THE VAT