HERI Faculty Survey 2016-2017 Results: Key Findings on Faculty Engagement and Satisfaction
The HERI Faculty Survey 2016-2017 Results shed light on faculty engagement in teaching, research, and service activities. It explores stress levels, institutional satisfaction, and perspectives on undergraduate education. Demographic data, faculty satisfaction, workplace dynamics, teaching practices, sources of stress, research activities, and institutional priorities are covered in the survey analysis.
Download Presentation

Please find below an Image/Link to download the presentation.
The content on the website is provided AS IS for your information and personal use only. It may not be sold, licensed, or shared on other websites without obtaining consent from the author. Download presentation by click this link. If you encounter any issues during the download, it is possible that the publisher has removed the file from their server.
E N D
Presentation Transcript
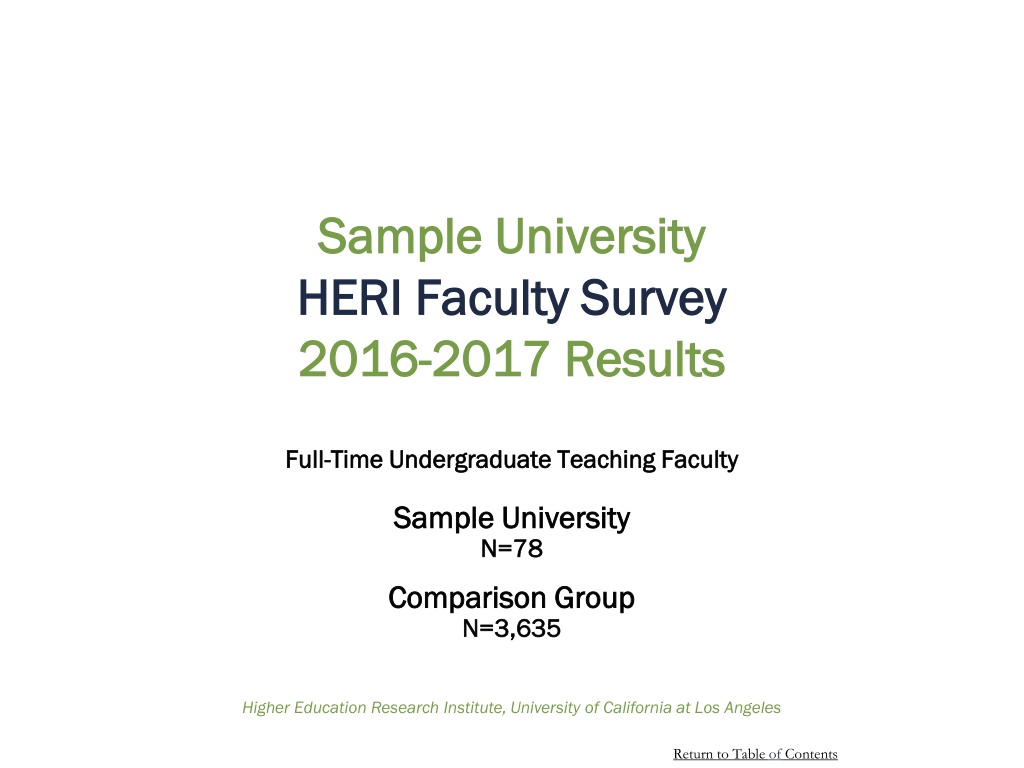
Sample University Sample University HERI Faculty Survey HERI Faculty Survey 2016 2016- -2017 Results 2017 Results Full Full- -Time Undergraduate Teaching Faculty Time Undergraduate Teaching Faculty Sample University Sample University N=78 N=78 Comparison Group Comparison Group N=3,635 N=3,635 Higher Education Research Institute, University of California at Los Angeles Return to Table of Contents Return to Table of Contents
THE FACULTY EXPERIENCE College Senior Survey Results from the HERI Faculty Survey highlight Results from the HERI Faculty Survey highlight key areas of faculty s engagement in teaching, key areas of faculty s engagement in teaching, research, and service activities. The survey research, and service activities. The survey also touches on faculty s level of stress, also touches on faculty s level of stress, satisfaction with their institution, and satisfaction with their institution, and perspectives for undergraduate education. perspectives for undergraduate education. Pedagogical practices Research and service activities Satisfaction and stress Institutional and departmental climate Return to Table of Contents Return to Table of Contents
Table of Contents Demographics Demographics Faculty Satisfaction Faculty Satisfaction Sex & Race/Ethnicity Sex & Race/Ethnicity Race/Ethnicity Race/Ethnicity Academic Department Academic Department Workplace Satisfaction Workplace Satisfaction Satisfaction with Compensation Satisfaction with Compensation Satisfaction with Pay Equity and Family Flexibility Satisfaction with Pay Equity and Family Flexibility Overall Faculty Job Satisfaction by Race Overall Faculty Job Satisfaction by Race Overall Overall Satisfaction Satisfaction Teaching Practices Teaching Practices Student Student- -Centered Pedagogy Centered Pedagogy Habits of Mind Habits of Mind Technology in the Classroom Technology in the Classroom Types of Courses Faculty Teach Types of Courses Faculty Teach Teaching Load Teaching Load Sources of Faculty Stress Sources of Faculty Stress Career Career- -Related Stress Related Stress Stress Due to Discrimination, by Gender Stress Due to Discrimination, by Gender Stress Due to Discrimination, by Race Stress Due to Discrimination, by Race Additional Sources of Stress Additional Sources of Stress Research Activities Research Activities Faculty s Perspectives on Campus Climate Faculty s Perspectives on Campus Climate Scholarly Productivity Scholarly Productivity Foci of Faculty Research Foci of Faculty Research Faculty Collaboration with Undergraduates on Faculty Collaboration with Undergraduates on Research Research Institutional Priority: Commitment to Diversity Institutional Priority: Commitment to Diversity Perspectives on Campus Climate for Diversity Perspectives on Campus Climate for Diversity Institutional Priority: Civic Engagement Institutional Priority: Civic Engagement Institutional Priority: Increasing Prestige Institutional Priority: Increasing Prestige Campus and Departmental Climate Campus and Departmental Climate Shared Governance Shared Governance Institutional Commitment Institutional Commitment Return to Table of Contents 2016 -2017 HERI Faculty Survey 3 Return to Table of Contents
A Note about HERI Constructs A Note about HERI Constructs We use the CIRP constructs throughout this We use the CIRP constructs throughout this PowerPoint to help summarize important PowerPoint to help summarize important information about your faculty from the HERI information about your faculty from the HERI Faculty Survey. Faculty Survey. Constructs Constructs Constructs statistically aggregate questions from the HERI Faculty Survey Constructs statistically aggregate questions from the HERI Faculty Survey that tap into key features of the faculty experience. These faculty traits and that tap into key features of the faculty experience. These faculty traits and institutional practices contribute to faculty s engagement with students in institutional practices contribute to faculty s engagement with students in the classroom, their research productivity, and their overall satisfaction. the classroom, their research productivity, and their overall satisfaction. Return to Table of Contents 4 Return to Table of Contents
Demographics Return to Table of Contents Return to Table of Contents
Demographics Demographics Race/Ethnicity Sex 100% 90% 80% 70% 34.4 % 60% 50.0% 65.6 % 50% 40% 30% 22.7% 20% 11.4% 11.4% 10% 2.3% 2.3% 0.0% Male Female 0% Latino Alaska Native Caucasian Asian American/ American/ Other Race/ Two or More Ethnicities White/ Ethnicity African American Black Races/ Indian/ Asian Return to Table of Contents 2016-2017 HERI Faculty Survey 6 Return to Table of Contents
Demographics Demographics 11.4% African American/Black 5.1% 11.4% American Indian/Alaska Native 0.8% 50.0% Asian American/Asian 81.4% 22.7% Latino 3.4% 2.3% White/Caucasian 3.4% 2.3% Other Race/Ethnicity 5.9% 0.0% Two or More Races/Ethnicities 0.0% 0% 10% 20% 30% 40% 50% 60% 70% 80% 90% 100% Your Institution Comparison Group Return to Table of Contents 2016-2017 HERI Faculty Survey 7 Return to Table of Contents
Demographics Demographics Academic Department (Aggregated) 21.4% Agriculture or Forestry 12.5% 7.1% Biological Sciences 6.3% 7.1% Business 12.5% 7.1% Education 0.0% 21.4% Engineering 3.1% 7.1% English 3.1% 0.0% Health-related 0.0% 0.0% History or Political Science 3.1% 0.0% Humanities 15.6% 14.3% Fine Arts 12.5% 7.1% Mathematics or Statistics 3.1% 0.0% Physical Sciences 15.6% 0.0% Social Sciences 3.1% 0.0% Other Technical 9.4% 7.1% Other Non-technical 0.0% 0% 10% 20% 30% 40% 50% 60% 70% 80% 90% 100% Men Women Return to Table of Contents 2016-2017 HERI Faculty Survey 8 Return to Table of Contents
Teaching Practices Return to Table of Contents Return to Table of Contents
Student Student- -Centered Pedagogy Centered Pedagogy Student-Centered Pedagogy measures the extent to which faculty use student-centered teaching and evaluation methods in their courses. 60 58 Construct Items 55.5 56 Student presentations Student evaluations of each others work Class discussions Cooperative learning (small groups) Experiential learning/Field studies Group projects Reflective writing/journaling Using student inquiry to drive learning 54 52.9 52 50.7 50 47.8 48 46 44.2 43.5 44 42 40 All Faculty Men Women Your Institution Comparison Group Return to Table of Contents 2016-2017 HERI Faculty Survey 10 Return to Table of Contents
Habits of Mind Habits of Mind These items measure the extent to which faculty structure courses to develop habits of mind for lifelong learning in students. 100% 90% 80% 43.4% 70% 60.4% 54.7% 66.4% 60% 75.0% 83.0% 69.7% 75.5% 43.2% 79.6% 50% 40% 30% 49.7% 20% 35.8% 35.8% 34.5% 28.0% 23.4% 21.2% 10% 18.9% 17.0% 14.8% 0% Support their opinions with a logical argument Seek solutions to problems and explain them to others Look up scientific research articles and resources Explore topics on their own, even though it was not required for class Accept mistakes as part of the learning process Your Institution Frequently Occasionally Comparison Group Frequently Occasionally Return to Table of Contents 2016-2017 HERI Faculty Survey 11 11 Return to Table of Contents
Technology in the Classroom Technology in the Classroom Classrooms are becoming more technologically advanced, and faculty increasingly utilize new technologies to engage students. 100% 90% 80% 52.0% 70% 36.0% 39.6% 60% 41.2% 50% 11.0% 40% 28.0% 20.0% 12.9% 30% 13.7% 46.8% 46.0% 41.7% 20% 37.5% 33.3% 25.9% 24.3% 24.0% 5.1% 10% 17.6% 8.7% 0% Videos or podcasts Simulations/animations Online homework or virtual labs Online discussion boards Audience response systems to gauge students understanding (e.g., clickers) Your Institution Frequently Occasionally Comparison Group Frequently Occasionally Return to Table of Contents 2016-2017 HERI Faculty Survey 12 12 Return to Table of Contents
Types of Courses Faculty Teach Types of Courses Faculty Teach 100% 90% 80% 70% 60% 50% 40% 72.4% 30% 53.8% 20% 25.9% 21.7% 20.5% 10% 16.9% 10.2% 1.7% Taught an honors course 0% Taught a seminar for first-year students Taught an area studies course (e.g., women's studies, ethnic studies, LGBTQ studies) Taught a service-learning course Your Institution Comparison Group Return to Table of Contents 2016-2017 HERI Faculty Survey 13 13 Return to Table of Contents
Average Number of Courses Taught This Term Average Number of Courses Taught This Term 10.00 9.00 8.00 7.00 6.00 5.27 5.23 5.02 5.00 4.00 2.85 2.83 2.82 3.00 2.00 1.00 0.00 All Faculty Men Women Your Institution Comparison Group Return to Table of Contents 2016-2017 HERI Faculty Survey 14 14 Return to Table of Contents
Research Activities Return to Table of Contents Return to Table of Contents
Scholarly Productivity Scholarly Productivity A unified measure of the scholarly activity of faculty. 60 58.9 58 56.7 56 Construct Items 53.8 53.6 53.4 54 Articles in academic and professional journals Chapters in edited volumes Professional writings published or accepted for publication in the last three years 52 50 48 46 44.5 44 42 40 All Faculty Men Women Your Institution Comparison Group Return to Table of Contents 2016-2017 HERI Faculty Survey 16 16 Return to Table of Contents
Foci of Faculty Research Foci of Faculty Research 100% 90% 80% 70% 60% 50% 40% 69.2% 30% 20% 39.9% 33.6% 33.1% 27.1% 20.7% 20.3% 10% 15.3% 0% Conducted research or writing focused on international/global issues Conducted research or writing focused on racial or ethnic minorities Conducted research or writing focused on women or gender issues Engaged in academic research that spans multiple disciplines Your Institution Comparison Group Return to Table of Contents 2016-2017 HERI Faculty Survey 17 17 Return to Table of Contents
Faculty Collaboration with Undergraduates Faculty Collaboration with Undergraduates on Research on Research With undergraduate research becoming a priority at many campuses, faculty are increasingly being asked to work with undergraduates on research projects. 100% 90% 80% 70% 60% 50% 40% 6.8% 30% 13.5% 17.2% 20% 32.0% 11.9% 11.9% 21.2% 10% 5.2% 17.2% 6.8% 6.8% 6.5% 0% Engaged undergraduates on your research project(s) Worked with undergraduates on their research project(s) Presented with undergraduates at conferences Your Institution Very Large Extent Large Extent Comparison Group Very Large Extent Large Extent Return to Table of Contents 2016-2017 HERI Faculty Survey 18 18 Return to Table of Contents
Faculty Satisfaction Return to Table of Contents Return to Table of Contents
Workplace Satisfaction Workplace Satisfaction 100% 90% 80% 70% 47.3% 43.7% 60% 39.5% 50% 44.1% 40% 47.1% 30% 46.0% 44.5% 20% 36.1% 32.8% 30.8% 27.1% 10% 15.1% 5.9% 0.0% 0.0% 0.0% Departmental leadership 0% Autonomy and independence Teaching load Departmental support for work/life balance Your Institution Very Satisfied Satisfied Comparison Group Very Satisfied Satisfied Return to Table of Contents 2016-2017 HERI Faculty Survey 20 20 Return to Table of Contents
Satisfaction with Compensation Satisfaction with Compensation 100% 90% 80% 43.6% 53.8% 70% 55.0% 47.3% 49.4% 41.0% 35.9% 74.0% 60% 50% 40% 30% 52.6% 46.2% 46.0% 44.9% 44.7% 43.6% 42.6% 20% 24.2% 10% 0% Salary Retirement benefits Opportunity for scholarly pursuits Leave policies (e.g., paternity/maternity leave, caring for a family member, stopping the tenure clock) Your Institution Very Satisfied Satisfied Comparison Group Very Satisfied Satisfied Return to Table of Contents 2016-2017 HERI Faculty Survey 21 21 Return to Table of Contents
Faculty Satisfaction with Pay Equity and Family Faculty Satisfaction with Pay Equity and Family Flexibility Flexibility 100% 90% 80% 41.3% 44.0% 47.4% 70% 48.0% 59.1% 65.3% 60% 50% 40% 30% 52.0% 50.6% 47.8% 45.3% 20% 37.1% 29.3% 10% 0% Relative equity of salary and job benefits Flexibility in relation to family matters or emergencies Overall job Your Institution Very Satisfied Satisfied Comparison Group Very Satisfied Satisfied Return to Table of Contents 2016-2017 HERI Faculty Survey 22 22 Return to Table of Contents
Overall Faculty Job Overall Faculty Job Satisfaction by Race Satisfaction by Race 100% 90% 80% 41.3% 47.4% 70% 48.0% 59.1% 65.3% 60% 37.0% 53.4% 50% 40% 30% 52.0% 47.8% 45.3% 20% 37.1% 33.0% 29.3% 24.4% 10% 0% American Indian/Alaska Native Asian American/ Asian African American/ Black Latino White/Caucasian Other Race/ Ethnicity Two or More Races/Ethnicities Your Institution Very Satisfied Satisfied Return to Table of Contents 2016-2017 HERI Faculty Survey 23 23 Return to Table of Contents
Overall Satisfaction Overall Satisfaction If given the choice, would you still to come to this institution? 100% 90% 80.2% 80% 74.4% 70% 60% 50% 40% 30% 18.3% 20% 9.0% 7.6% 10% 5.2% 3.0% 2.0% 0.2% 0.1% 0% Definitely Yes Probably Yes Not Sure Probably No Definitely No Your Institution Comparison Group Return to Table of Contents 2016-2017 HERI Faculty Survey 24 24 Return to Table of Contents
Sources of Faculty Stress Return to Table of Contents Return to Table of Contents
Career Career- -Related Stress Related Stress Career-Related Stress measures the amount of stress faculty experience related to their career. 60 58 Construct Items 56 Committee work Students Research or publishing demands Institutional procedures/red tape Teaching load Lack of personal time Self-imposed high expectations 53.2 54 52.4 51.9 51.6 52 50.8 50.0 50 48 46 44 42 40 All Faculty Men Women Your Institution Comparison Group Return to Table of Contents 2016-2017 HERI Faculty Survey 26 26 Return to Table of Contents
Stress Due to Discrimination, by Gender Stress Due to Discrimination, by Gender 100% 90% 80% 41.3% 44.0% 47.4% 70% 48.0% 59.1% 65.3% 60% 50% 40% 30% 52.0% 50.6% 47.8% 45.3% 20% 37.1% 29.3% 10% 0% All Faculty Men Faculty Women Faculty Your Institution Extensive Somewhat Comparison Group Extensive Somewhat Return to Table of Contents 2016-2017 HERI Faculty Survey 27 27 Return to Table of Contents
Stress Due to Discrimination, by Race Stress Due to Discrimination, by Race 100% 90% 80% 41.3% 44.0% 47.4% 70% 48.0% 59.1% 65.3% 60% 50% 40% 30% 52.0% 50.6% 47.8% 45.3% 20% 37.1% 29.3% 10% 0% White/Caucasian Faculty Asian American/Asian Faculty Traditionally Underrepresented Racial Minority Faculty Your Institution Extensive Somewhat Comparison Group Extensive Somewhat Return to Table of Contents 2016-2017 HERI Faculty Survey 28 28 Return to Table of Contents
Additional Sources of Faculty Stress Additional Sources of Faculty Stress Please indicate the extent to which each of the following has been a source of stress for you during the past year: 100% 90% 80% 44.5% 70% 44.0% 52.0% 52.1% 53.2% 57.9% 59.2% 63.6% 60% 50% 54.5% 40% 40.3% 30% 49.4% 48.0% 42.8% 41.8% 20% 40.3% 36.8% 34.2% 29.2% 21.7% 10% 16.9% 0% Research or publishing demands Review/promotion process Job security Increased work responsibilities Institutional budget cuts Your Institution Extensive Somewhat Comparison Group Extensive Somewhat Return to Table of Contents 2016-2017 HERI Faculty Survey 29 29 Return to Table of Contents
Faculty Perspectives on Campus Climate Return to Table of Contents Return to Table of Contents
Institutional Priority: Commitment to Diversity Institutional Priority: Commitment to Diversity 100% 90% 80% 41.3% 44.0% 47.4% 70% 48.0% 59.1% 65.3% 60% 50% 40% 30% 52.0% 50.6% 47.8% 45.3% 20% 37.1% 29.3% 10% 0% Recruit more minority students Promote gender diversity in the faculty and administration Promote racial and ethnic diversity in the faculty and administration Your Institution Highest Priority High Priority Comparison Group Highest Priority High Priority Return to Table of Contents 2016-2017 HERI Faculty Survey 31 31 Return to Table of Contents
Perspectives on Campus Climate for Diversity Perspectives on Campus Climate for Diversity 100% 90% 80% 43.6% 53.8% 70% 55.0% 49.4% 41.0% 74.0% 60% 50% 40% 30% 52.6% 46.2% 44.7% 43.6% 42.6% 20% 24.2% 10% 0% This institution has effective hiring practices and policies that increase faculty diversity This institution takes responsibility for educating underprepared students Faculty are not prepared to deal with conflict over diversity issues in the classroom Your Institution Strongly Agree Somewhat Agree Comparison Group Strongly Agree Somewhat Agree Return to Table of Contents 2016-2017 HERI Faculty Survey 32 32 Return to Table of Contents
Institutional Priority: Civic Engagement Institutional Priority: Civic Engagement Civic Engagement measures the extent to which faculty believe their institution is committed to facilitating civic engagement among students and faculty. 60 58 Construct Items 56 Facilitate student involvement in community service Provide resources for faculty to engage in community-based teaching or research Create and sustain partnerships with surrounding communities 53.2 54 52.4 51.9 51.6 51.6 52 50.8 50 48 46 44 42 40 All Faculty Men Women Your Institution Comparison Group Return to Table of Contents 2016-2017 HERI Faculty Survey 33 33 Return to Table of Contents
Institutional Priority: Increasing Prestige Institutional Priority: Increasing Prestige 100% 90% 80% 41.3% 44.0% 47.4% 70% 48.0% 59.1% 65.3% 60% 50% 40% 30% 52.0% 50.6% 47.8% 45.3% 20% 37.1% 29.3% 10% 0% Increase or maintain institutional prestige Hire faculty stars Increase the selectivity of the student body through more competitive admissions criteria Your Institution Highest Priority High Priority Comparison Group Highest Priority High Priority Return to Table of Contents 2016-2017 HERI Faculty Survey 34 34 Return to Table of Contents
Facultys Perspectives on Faculty s Perspectives on Campus and Departmental Climate Campus and Departmental Climate 100% 90% 80% 43.6% 53.8% 70% 55.0% 47.3% 49.4% 41.0% 35.9% 74.0% 60% 50% 40% 30% 52.6% 46.2% 46.0% 44.9% 44.7% 43.6% 42.6% 20% 24.2% 10% 0% There is a lot of campus racial conflict here My research is valued by faculty in my department My teaching is valued by faculty in my department My service is valued by faculty in my department Your Institution Strongly Agree Somewhat Agree Comparison Group Strongly Agree Somewhat Agree Return to Table of Contents 2016-2017 HERI Faculty Survey 35 35 Return to Table of Contents
Faculty Perspectives on Shared Governance Faculty Perspectives on Shared Governance 100% 90% 19.6% 80% 28.3% 50.0% 70% 64.5% 60% 50% 13.7% 40% 76.1% 15.4% 30% 58.7% 47.1% 20% 37.7% 34.6% 26.9% 10% 0% Faculty are sufficiently involved in campus decision-making The faculty are typically at odds with campus administration Administrators consider faculty concerns when making policy Your Institution Strongly Agree Somewhat Agree Comparison Group Strongly Agree Somewhat Agree Return to Table of Contents 2016-2017 HERI Faculty Survey 36 36 Return to Table of Contents
Institutional Commitment Institutional Commitment 100% 90% 80% 70% 60% 50% 40% 72.4% 63.8% 30% 53.8% 20% 28.9% 10% 11.7% 10.4% 0% In the past year, have you considered leaving academe for another job? In the past year, have you considered leaving this institution for another? Do you plan to retire within the next three years? Your Institution Comparison Group Return to Table of Contents 2016-2017 HERI Faculty Survey 37 37 Return to Table of Contents
The more you get to know your faculty, the better you can understand their needs. For more information about HERI/CIRP Surveys The Freshman Survey Your First College Year Survey Diverse Learning Environments Survey College Senior Survey The Faculty Survey Staff Climate Survey Please contact: heri@ucla.edu (310) 825-1925 www.heri.ucla.edu Return to Table of Contents 2016-2017 HERI Faculty Survey 38 Return to Table of Contents
