Challenges in Forecasting Monetary Policy Amid Economic Uncertainty

Economic forecasters faced challenges in predicting the impact of inflation post-pandemic, leading to delayed monetary policy adjustments by the Fed. By analyzing inflation forecasts and policy rates, the study evaluates the potential outcomes with perfect foresight. The comparison between actual and forecasted data highlights the need for improved forecasting methods to navigate economic complexities effectively.

Download Presentation

Please find below an Image/Link to download the presentation.
The content on the website is provided AS IS for your information and personal use only. It may not be sold, licensed, or shared on other websites without obtaining consent from the author. Download presentation by click this link. If you encounter any issues during the download, it is possible that the publisher has removed the file from their server.
E N D
Presentation Transcript
Forecasting for Monetary Policy: Far From Perfect, but Good Enough David Wilcox Senior Fellow, Peterson Institute for International Economics Director of US Economic Research, Bloomberg Economics May 23, 2024
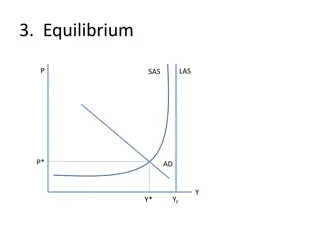
Most economic forecasters failed to anticipate how big a problem inflation would be in the wake of the pandemic Partly for that reason, the Fed seemed late to tighten monetary policy Overview How different would inflation have been if the Fed had a perfect crystal ball?
Step 1: Start with forecasts of inflation and the unemployment rate Policy was based partly on these forecasts Strategy: Three steps Step 2: Assess how different the Fed s policy rate might have been with a perfect forecast Step 3: Estimate how much lower inflation might have been with a higher policy rate
Step 1: Forecasts Inflation
6 5 four-quarter percent change Actual core PEC price index, 4 Inflation: --actual 3 2 1 0 2009 2011 2013 2015 2017 2019 2021 2023 Source: BEA, Bloomberg Economics
6 5 Actual Forecast from four quarters earlier four-quarter percent change core PEC price index, 4 Inflation --actual --forecasted 3 2 1 0 2009 2011 2013 2015 2017 2019 2021 2023 Source: BEA, Bloomberg Economics
6 1Q22 3Q22 4Q21 4Q22 5 Four-quarter core PCE inflation, percent 2Q22 1Q23 2Q23 3Q21 4 2Q21 Inflation --actual --forecasted 3Q23 Actual 4Q23 3 1Q24 1Q21 2 Observations from before the Covid-related inflation burst (2009:Q2 - 2020:Q4) (Another view) 1 0 0 1 2 3 4 5 6 Four-quarter core PCE inflation, percent Forecast from four quarters earlier Source: BEA, Bloomberg Economics
Unemployment rate I did the same drill, comparing actual with forecast Summary: Forecasters missed how fast the economy collapsed in 2020 and how quickly it recovered starting in 2021 Forecasts
We need a method for quantifying how policymakers respond to changes in economic circumstances Step 2: How much might these forecast errors have mattered for the policy rate? Fortunately, John Taylor gave us a method The Taylor rule uses inflation and unemployment as inputs to generate prescriptions for the Fed s policy rate
it= 0 + 1t - 2ut+ 3 t The Taylor Rule: A formula for setting the policy rate where: it = federal funds rate t = inflation rate ut = unemployment rate t = time trend
8 6 The Taylor rule gives a decent approximation of how policy has been set since 1990 Percent 4 2 0 1991 1995 1999 2003 2007 2011 2015 2019 2023 Actual federal funds rate Rate prescribed by rule Note: Coefficients of the Taylor rule are estimated over the sample period from 1999:Q1 through 2008:Q4. Gray bars indicate recessions as determined by the NBER. Source: Federal Reserve, BLS, BEA, David Reifschneider, NBER, Bloomberg Economics
8 Actual Simulated based on perfect forsight According to one version of the Taylor rule, this is how different the policy rate would have been with perfect forecasts 6 Federal funds rate, percent 4 2 0 2008 2010 2012 2014 2016 2018 2020 2022
Step 3: How much might these differences in the policy rate have mattered for inflation? Feed the difference in policy rates into a macro model See what the model says about how big the effect of inflation would have been
6 Actual 5 four-quarter percent change Step 3: How much might these differences in the policy rate have mattered for inflation? Inflation under perfect-foresight policy core PEC price index, 4 3 2 1 0 2009 2011 2013 2015 2017 2019 2021 2023 Source: BEA, Bloomberg Economics
How different would inflation have been if the Fed had a perfect crystal ball? The initial runup would have been virtually the same The peak inflation rate might have been a little lower Summary Inflation might now be a little closer to the Fed s 2% target There would have been a cost: Unemploy- ment would probably also be higher
The unemployment rate Forecasts
14 Actual 12 Unemployment rate, percent 10 Unemployment --actual 8 6 4 2 0 2004 2006 2008 2010 2012 2014 2016 2018 2020 2022 2024 Source: BLS, Bloomberg Economics
14 Actual Forecast from four quarters earlier 12 Unemployment rate, percent 10 Unemployment --actual --forecasted 8 6 4 2 0 2004 2006 2008 2010 2012 2014 2016 2018 2020 2022 2024 Source: BLS, Bloomberg Economics
16 First four quarters of the Covid era Unemployment rate, percent 12 Unemployment --actual --forecasted 8 Actual 4 y = 0.20 + 0.94x R = 0.79 (Another view) 0 0 4 8 12 16 Unemployment rate, percent Forecast from four quarters earlier Note: The sample of unemployment rate outcomes runs from 2004:Q2 through 2024:Q1. The associated forecasts were submitted four quarters earlier. The red dots show outcomes for 2020:Q2 through 2021:Q1 compared to forecasts made four quarters earlier. The sample used to estimate the trend line excludes the observations shown by the red dots.