SUFG Stakeholder Workshop Insights on Utility Forecasting and Evaluation

Stakeholder feedback from the ENERGY CENTER State Utility Forecasting Group (SUFG) workshop highlights considerations for improving load forecasting techniques, including the use of binary variables, end-use models, state-level data access, and economic model adjustments. Insights on electricity price variables and past forecast comparisons are discussed to enhance accuracy and relevance in forecasting utilities.

Download Presentation

Please find below an Image/Link to download the presentation.
The content on the website is provided AS IS for your information and personal use only. It may not be sold, licensed, or shared on other websites without obtaining consent from the author. Download presentation by click this link. If you encounter any issues during the download, it is possible that the publisher has removed the file from their server.
E N D
Presentation Transcript
ENERGY CENTER State Utility Forecasting Group (SUFG) Independent Load Forecast Stakeholder Workshop #2 April 18, 2016 1
ENERGY CENTER State Utility Forecasting Group (SUFG) Stakeholder Feedback Use of binary variables instead of after- the-fact adjustment for seasonal peaks We think this potentially has merit but was not incorporated last year due to time limitations. Preliminary investigations had some issues with variables being statistically insignificant, but we will look at this more thoroughly this year. 2
ENERGY CENTER State Utility Forecasting Group (SUFG) Stakeholder Feedback Use of end-use or SAE models to measure historical DSM Unfortunately, this would require access to data that we don t have, such as load shape information at the state level 3
ENERGY CENTER State Utility Forecasting Group (SUFG) Stakeholder Feedback Develop separate Louisiana models with and without CHP and use our judgment Will discuss this in the section on the state econometric models 4
ENERGY CENTER State Utility Forecasting Group (SUFG) Stakeholder Feedback Use of state-level electricity price variable is inappropriate because price is a function of electricity consumption We disagree for a number of reasons, including that our models use either lagged prices or moving average prices and today s consumption does not affect previous year s prices 5
ENERGY CENTER State Utility Forecasting Group (SUFG) Considerations When Comparing Past Forecasts to Actual Actual weather conditions could be quite different than normal Energy efficiency requirements may have changed Forecasts may reflect demand response that was available but not used The geographic footprint may have changed It is unlikely that significant economic events were foreseen 6
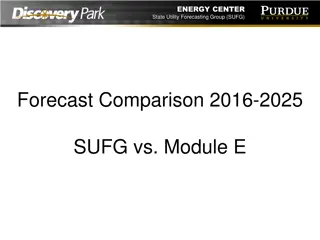
ENERGY CENTER State Utility Forecasting Group (SUFG) Forecast Comparison 2016-2025 2015 ILF to Module E for PY2016 7
ENERGY CENTER State Utility Forecasting Group (SUFG) Module E Data Module E forecasts provide a series of projections of non-coincident peaks at the asset owner level (24 months followed by 8 years of summer and winter peaks) Zonal and system coincident peak values are provided for a single year We calculated zonal and system coincidence factors from these values and applied them to the projected values (not available for winter) to find LRZ non-coincident and system coincident peaks 8
ENERGY CENTER State Utility Forecasting Group (SUFG) Forecast Comparisons ILF Allocates state-level forecasts to LRZ levels; Uses conversion factors to determine LRZ non- coincident peaks and coincidence factors to determine system-wide peak load; Net load: with EE/DR/DG adjustment; Gross load: without EE/DR/DG adjustment. MISO Module E Aggregates asset owner level loads to LRZ levels; Applies intra-zonal/MISO- wide coincidence factors to convert asset owner level peak loads to zonal peaks and system-wide peak load; Does not include DR/DG adjustment, may include EE adjustment. 9
ENERGY CENTER State Utility Forecasting Group (SUFG) Comparison Charts Module E solid black line ILF Gross dashed black line ILF Gross high/low bands hashed area ILF Net dashed red line ILF Net high/low bands solid area 2014 actual value diamond Note: 2014 was a mild summer, so weather normal peaks would likely be higher 10
ENERGY CENTER State Utility Forecasting Group (SUFG) SUFG Gross & Net Forecast vs. Module E LRZ 1 23,917 21,917 MW 19,917 17,917 15,917 13,917 2014 2015 2016 2017 2018 2019 2020 2021 2022 2023 2024 2025 11 SUFG_Gross Module E LRZ 1 SUFG_Net Actual Peak
ENERGY CENTER State Utility Forecasting Group (SUFG) SUFG Gross & Net Forecast vs. Module E LRZ 2 16,728 15,428 MW 14,128 12,828 11,528 10,228 2014 2015 2016 2017 2018 2019 2020 2021 2022 2023 2024 2025 12 SUFG_Gross Module E LRZ 2 SUFG_Net Actual Peak
ENERGY CENTER State Utility Forecasting Group (SUFG) SUFG Gross & Net Forecast vs. Module E LRZ 3 12,565 11,665 10,765 MW 9,865 8,965 8,065 7,165 2014 2015 2016 2017 2018 2019 2020 2021 2022 2023 2024 2025 13 SUFG_Gross Module E LRZ 3 SUFG_Net Actual Peak
ENERGY CENTER State Utility Forecasting Group (SUFG) SUFG Gross & Net Forecast vs. Module E LRZ 4 12,488 11,788 11,088 MW 10,388 9,688 8,988 8,288 2014 2015 2016 2017 2018 2019 2020 2021 2022 2023 2024 2025 SUFG_Gross Module E LRZ 4 SUFG_Net Actual Peak 14
ENERGY CENTER State Utility Forecasting Group (SUFG) SUFG Gross & Net Forecast vs. Module E LRZ 5 11,756 11,056 10,356 MW 9,656 8,956 8,256 7,556 2014 2015 2016 2017 2018 2019 2020 2021 2022 2023 2024 2025 15 SUFG_Gross Module E LRZ 5 SUFG_Net Actual Peak
ENERGY CENTER State Utility Forecasting Group (SUFG) SUFG Gross & Net Forecast vs. Module E LRZ 6 23,008 21,308 MW 19,608 17,908 16,208 14,508 2014 2015 2016 2017 2018 2019 2020 2021 2022 2023 2024 2025 SUFG_Gross Module E LRZ 6 SUFG_Net Actual Peak 16
ENERGY CENTER State Utility Forecasting Group (SUFG) SUFG Gross & Net Forecast vs. Module E LRZ 7 26,188 24,288 MW 22,388 20,488 18,588 16,688 2014 2015 2016 2017 2018 2019 2020 2021 2022 2023 2024 2025 SUFG_Gross Module E LRZ 7 SUFG_Net Actual Peak 17
ENERGY CENTER State Utility Forecasting Group (SUFG) SUFG Gross & Net Forecast vs. Module E LRZ 8 9,574 8,974 8,374 MW 7,774 7,174 6,574 5,974 2014 2015 2016 2017 2018 2019 2020 2021 2022 2023 2024 2025 18 SUFG_Gross Module E LRZ 8 SUFG_Net Actual Peak
ENERGY CENTER State Utility Forecasting Group (SUFG) SUFG Gross & Net Forecast vs. Module E LRZ 9 27,572 25,672 23,772 MW 21,872 19,972 18,072 16,172 2014 2015 2016 2017 2018 2019 2020 2021 2022 2023 2024 2025 SUFG_Gross Module E LRZ 9 SUFG_Net Actual Peak 19
ENERGY CENTER State Utility Forecasting Group (SUFG) SUFG Gross & Net Forecast vs. Module E LRZ 10 6,658 6,158 5,658 MW 5,158 4,658 4,158 2014 2015 2016 2017 2018 2019 2020 2021 2022 2023 2024 2025 20 SUFG_Gross Module E LRZ 10 SUFG_Net Actual Peak
ENERGY CENTER State Utility Forecasting Group (SUFG) SUFG Gross & Net Forecast vs. Module E MISO System 165000 155000 145000 MW 135000 125000 115000 105000 2014 2015 2016 2017 2018 2019 2020 2021 2022 2023 2024 2025 21 SUFG_Gross Module E MISO System SUFG_Net Actual Peak
ENERGY CENTER State Utility Forecasting Group (SUFG) Historical Summer Peak Demand* (Metered Load in MW) LRZ 2010 2011 2012 2013 2014 1 15,992 17,601 17,996 17,909 17,018 2 12,392 13,164 13,228 12,639 11,730 3 8,534 8,991 9,188 8,880 8,283 4 9,863 10,277 10,409 9,523 9,563 5 9,084 9,129 9,171 8,428 8,487 6 16,391 18,324 18,302 17,629 17,170 7 20,633 22,232 22,655 21,598 19,293 8 7,323 8,002 7,488 7,033 7,058 9 18,777 19,218 19,223 19,517 19,173 10 4,633 4,919 4,847 4,648 4,297 MISO 118,833 127,556 126,590 122,445 114,709 22 * LRZ values are non-coincident with MISO system peak
ENERGY CENTER State Utility Forecasting Group (SUFG) Annual Energy and Winter Peak Demands We have not been provided annual energy numbers for comparison The lack of information on winter peak coincidence at the zonal and system levels means that any comparison would bias the Module E results high We would be comparing the sum of asset owner non-coincident peaks to ILF forecasts that are either coincident within the LRZ or within the system 23
ENERGY CENTER State Utility Forecasting Group (SUFG) State Econometric Models
ENERGY CENTER State Utility Forecasting Group (SUFG) Model Development We used a similar process to last year to find models with a good fit, with an appropriate mix of explanatory variables, and that passed the tests for serial correlation and heteroskedasticity. Added another year of history (2014) Used the population-weighted virtual weather stations that were developed last year For some states, changes were made to the explanatory variables or sample periods changes (if any) are shown for each state 25
ENERGY CENTER State Utility Forecasting Group (SUFG) Dependent and Explanatory Variables Variables Eviews name Units Dependent variable: Electricity sales ELECTRICITY_SALES Gwhs Explanatory variables: Electricity prices REAL_ELECTRICITY_PRICE Cents/Kwh in 2009 dollars * Natural gas prices REAL_NATURAL_GAS_PRICE Dollars/Mcf in 2009 dollars * Real personal income REAL_INCOME Thousands of 2009 dollars Population POPULATION Number of people Manufacturing employment MANUFACTURING_EMP Number of jobs Non-manufacturing employment NON_MANUFACTURING_EMP Number of jobs Non-farm employment NON_FARM_EMP Number of jobs Gross state product REAL_GSP Millions in 2009 dollars Cooling degree days CDD Fahrenheit (base 65) Heating degree days HDD Fahrenheit (base 65) * Original data was in nominal dollars. SUFG converted it to real 2009 dollars using state level CPI from IHS Global Insight. 26
ENERGY CENTER State Utility Forecasting Group (SUFG) Statistical Tests Correlogram Q Statistics (Test for serial correlation) Breusch-Godfrey LM Test (Test for serial correlation) White Test (Test for heteroskedasticity) Chow Breakpoint Test (Test for model stability) Histogram Normality Test 27
ENERGY CENTER State Utility Forecasting Group (SUFG) Arkansas Dependent Variable: ELECTRICITY_SALES Method: Least Squares Sample: 1990 2014 Included observations: 25 Elasticity at 2014 (weather at means) Variable Coefficient Std. Error t-Statistic Prob. C @MOVAV(REAL_ELECTRICITY_PRICE,4) GSP CDD HDD R-squared Adjusted R-squared S.E. of regression F-statistic Prob(F-statistic) 18922.77 -1644.084 0.278528 3.56418 1.082386 0.994928 0.993914 524.0147 980.8533 0.000000 3202.394 176.6988 0.016122 0.488213 0.358589 Mean dependent var S.D. dependent var Durbin-Watson stat 5.908946 -9.304444 17.27614 7.300467 3.018457 0.0000 0.0000 0.0000 0.0000 0.0068 40551.61 6716.979 1.575739 -0.2484 0.6491 0.1590 0.0928 Change: electricity price uses 4-year moving averages instead of 3-year moving averages previously 28
ENERGY CENTER State Utility Forecasting Group (SUFG) Illinois Dependent Variable: ELECTRICITY_SALES Method: Least Squares Sample: 1990 2014 Included observations: 25 Elasticity at 2014 (weather at means) Variable Coefficient Std. Error t-Statistic Prob. C @MOVAV(REAL_ELECTRICITY_PRICE,5) GSP CDD HDD R-squared Adjusted R-squared S.E. of regression F-statistic Prob(F-statistic) 88116.68 -2367.163 0.082279 10.70239 1.510145 0.99072 0.988864 1133.768 533.7845 0.000000 14962.59 612.858 0.014402 1.338207 0.570358 Mean dependent var S.D. dependent var Durbin-Watson stat 5.889134 -3.862499 5.712963 7.997555 2.647716 0.0000 0.0010 0.0000 0.0000 0.0154 133512.2 10743.76 1.978099 -0.1419 0.3891 0.0778 0.0670 No changes in drivers or starting year from 2015 model 29
ENERGY CENTER State Utility Forecasting Group (SUFG) Indiana Dependent Variable: ELECTRICITY_SALES Method: Least Squares Sample: 1990 2014 Included observations: 25 Elasticity at 2014 (weather at means) Variable C @MOVAV(REAL_ELECTRICITY_PRICE,3) @MOVAV(REAL_NATURAL_GAS_PRICE,2) REAL_GSP CDD HDD R-squared Adjusted R-squared S.E. of regression F-statistic Prob(F-statistic) Coefficient 23938.99 -1225.3 363.4235 0.252658 6.156419 1.813066 0.996911 0.996098 681.7222 1226.353 0.000000 Std. Error 3441.989 227.6832 103.8457 0.004863 0.764461 0.381139 Mean dependent var S.D. dependent var Durbin-Watson stat t-Statistic 6.954987 -5.381601 3.499648 51.95145 8.053285 4.756967 Prob. 0.0000 0.0000 0.0024 0.0000 0.0000 0.0001 96216.86 10913.56 2.007218 -0.0944 0.0246 0.6810 0.0674 0.1033 Change: natural gas price uses 2-year moving averages instead of 3-year moving averages previously 30
ENERGY CENTER State Utility Forecasting Group (SUFG) Iowa Dependent Variable: ELECTRICITY_SALES Method: Least Squares Sample: 1993 2014 Included observations: 22 Elasticity at 2014 (weather at means) Coefficient Std. Error t-Statistic Prob. Variable C REAL_ELECTRICITY_PRICE(-2) REAL_NATURAL_GAS_PRICE(-2) REAL_INCOME CDD HDD R-squared Adjusted R-squared S.E. of regression F-statistic Prob(F-statistic) 16948.22 -1286.671 188.075 0.000214 2.933447 0.664417 0.994364 0.992603 404.0402 564.583 0.000000 3105.043 282.2488 60.33242 0.0000106 0.694937 0.212405 Mean dependent var S.D. dependent var Durbin-Watson stat 5.458289 -4.558639 3.117313 20.1258 4.221169 3.128059 0.0001 0.0003 0.0066 0.0000 0.0006 0.0065 40849.62 4697.763 1.351322 -0.2024 0.0297 0.6498 0.0664 0.1084 Changes: starting year has been changed from 1990 to 1993; electricity price has been replaced by a 2-year lagged electricity price; per capita income and real GSP have been replaced by total income 31
ENERGY CENTER State Utility Forecasting Group (SUFG) Kentucky As we did last year, we developed a model using a load adjustment for the closure of the Paducah Gaseous Diffusion Plant (PGDP) in mid-2013 A large (3 GW) load on the TVA system that accounted for more than 10% of the state s retail sales 32
ENERGY CENTER State Utility Forecasting Group (SUFG) Kentucky Dependent Variable: ELECTRICITY_SALES Method: Least Squares Sample: 1993 2014 Included observations: 22 Elasticity at 2014 (weather at means) Variable C @MOVAV(REAL_ELECTRICITY_PRICE,3) @MOVAV(REAL_NATURAL_GAS_PRICE,3) POPULATION CDD HDD R-squared Adjusted R-squared S.E. of regression F-statistic Prob(F-statistic) Coefficient -84835.11 -2366.73 770.7436 0.037409 4.149048 3.643589 0.969814 0.96038 1522.033 102.8079 0.000000 Std. Error 10649.88 733.9402 217.1742 0.002667 1.885999 1.189408 Mean dependent var 84063.79 S.D. dependent var Durbin-Watson stat t-Statistic -7.965827 -3.224691 3.548964 14.02876 2.199921 3.063362 Prob. 0.0000 0.0053 0.0027 0.0000 0.0429 0.0074 -0.1903 0.0585 1.8110 0.0651 0.1929 7646.604 2.022556 Change: starting year has been changed from 1994 to 1993 33
ENERGY CENTER State Utility Forecasting Group (SUFG) Louisiana Due to the historically high rate of customer- owned generation in Louisiana, the relationship between GSP and electricity sales is weak We were unable to find a model that used GSP as a driver this year The primary driver in the model (income) has a low elasticity, which means we may end up with an unreasonably low forecast 34
ENERGY CENTER State Utility Forecasting Group (SUFG) Louisiana As was suggested by one stakeholder group, we will likely construct a second model based on the combination of sales and CHP Note: this data is publicly available through EIA We will provide the details of this model to the stakeholders and explain the basis for our choice of approaches going forward 35
ENERGY CENTER State Utility Forecasting Group (SUFG) Louisiana Dependent Variable: ELECTRICITY_SALES Method: Least Squares Sample: 1990 2014 Included observations: 25 Elasticity at 2014 (weather at means) Variable C @MOVAV(REAL_ELECTRICITY_PRICE,3) REAL_INCOME CDD HDD R-squared Adjusted R-squared S.E. of regression F-statistic Prob(F-statistic) Coefficient 74640.57 -4215.296 0.000115 4.621522 4.264524 0.971777 0.966132 1270.255 172.1575 0.000000 Std. Error 7268.002 434.2424 0.0000123 1.465265 1.328142 Mean dependent var S.D. dependent var Durbin-Watson stat t-Statistic 10.26975 -9.707242 9.370875 3.154052 3.210895 Prob. 0.0000 0.0000 0.0000 0.0050 0.0044 77122.65 6902.32 1.802795 -0.3385 0.2503 0.1747 0.0839 Change: GSP has been replaced by total income 36
ENERGY CENTER State Utility Forecasting Group (SUFG) Michigan Dependent Variable: ELECTRICITY_SALES Method: Least Squares Sample: 1990 2014 Included observations: 25 Elasticity at 2014 (weather at means) Variable C REAL_ELECTRICITY_PRICE(-2) REAL_INCOME/POPULATION REAL_GSP CDD HDD R-squared Adjusted R-squared S.E. of regression F-statistic Prob(F-statistic) Coefficient 54669.24 -2470.396 924.9092 0.0618 5.475645 1.230438 0.986593 0.983065 1082.554 279.6341 0.000000 Std. Error 8050.363 398.1817 155.9355 0.01773 1.350775 0.557135 Mean dependent var S.D. dependent var Durbin-Watson stat t-Statistic 6.790904 -6.204191 5.931356 3.485615 4.053705 2.208508 Prob. 0.0000 0.0000 0.0000 0.0025 0.0007 0.0397 100050.7 8318.694 1.946352 -0.2394 0.3565 0.2477 0.0440 0.0761 No changes in drivers or starting year from 2015 model 37
ENERGY CENTER State Utility Forecasting Group (SUFG) Minnesota Dependent Variable: ELECTRICITY_SALES Method: Least Squares Sample: 1991 2014 Included observations: 24 Elasticity at 2014 (weather at means) Variable C @MOVAV(REAL_ELECTRICITY_PRICE,5) @MOVAV(REAL_NATURAL_GAS_PRICE,4) REAL_INCOME CDD HDD R-squared Adjusted R-squared S.E. of regression F-statistic Prob(F-statistic) Coefficient 20842.71 -785.6936 465.4847 0.000154 6.109774 1.012256 0.992912 0.990943 681.2834 504.2722 0.000000 Std. Error 3265.525 286.9386 120.0009 0.00000556 1.119473 0.279173 Mean dependent var S.D. dependent var Durbin-Watson stat t-Statistic 6.382653 -2.738194 3.87901 27.74229 5.457725 3.625913 Prob. 0.0000 0.0135 0.0011 0.0000 0.0000 0.0019 60825.52 7158.567 1.444467 -0.0981 0.0503 0.5647 0.0650 0.1328 Changes: starting year has been changed from 1992 to 1991; electricity price now uses 5-year moving averages instead of 4-year moving averages 38
ENERGY CENTER State Utility Forecasting Group (SUFG) Mississippi Dependent Variable: ELECTRICITY_SALES Method: Least Squares Sample: 1993 2014 Included observations: 22 Elasticity at 2014 (weather at means) Variable Coefficient Std. Error t-Statistic Prob. C @MOVAV(REAL_ELECTRICITY_PRICE,3) REAL_INCOME(-1) REAL_GSP CDD HDD R-squared Adjusted R-squared S.E. of regression F-statistic Prob(F-statistic) 13364.2 -1736.159 0.000136 0.256937 3.047907 1.709259 0.98633 0.982059 580.879 230.8954 0.000000 4658.947 243.0253 5.15E-05 0.090669 0.687354 0.615461 Mean dependent var S.D. dependent var Durbin-Watson stat 2.868501 -7.143943 2.643591 2.833794 4.434262 2.777203 0.0111 0.0000 0.0177 0.0120 0.0004 0.0135 44657.31 4336.682 2.072365 -0.3049 0.3000 0.4921 0.1529 0.0952 Change: electricity price now uses 3-year moving averages instead of 2-year moving averages 39
ENERGY CENTER State Utility Forecasting Group (SUFG) Missouri Dependent Variable: ELECTRICITY_SALES Method: Least Squares Sample: 1998 2014 Included observations: 17 Elasticity at 2014 (weather at means) Variable Coefficient Std. Error t-Statistic Prob. C @MOVAV(REAL_ELECTRICITY_PRICE,5) POPULATION NON_MANUFACTURING_EMP CDD HDD R-squared Adjusted R-squared S.E. of regression F-statistic Prob(F-statistic) -105234.8 -2284.499 0.017045 0.0321 8.24986 2.472161 0.990307 0.985901 698.4027 224.7692 0.000000 11590.11 426.4347 0.00162 0.005897 0.93112 0.53897 Mean dependent var S.D. dependent var Durbin-Watson stat -9.079702 -5.357206 10.5187 5.443887 8.860149 4.586823 0.0000 0.0002 0.0000 0.0002 0.0000 0.0008 78825.52 5881.856 1.904002 -0.2249 1.2327 0.9482 0.1597 0.1446 No changes in drivers or starting year from 2015 model 40
ENERGY CENTER State Utility Forecasting Group (SUFG) Montana Dependent Variable: ELECTRICITY_SALES Method: Least Squares Sample: 1996 2014 Included observations: 19 Elasticity at 2014 (weather at means) Variable Coefficient Std. Error t-Statistic Prob. C REAL_ELECTRICITY_PRICE @MOVAV(REAL_NATURAL_GAS_PRICE,5) REAL_INCOME/POPULATION MANUFACTURING_EMP CDD HDD R-squared Adjusted R-squared S.E. of regression F-statistic Prob(F-statistic) -524.7233 -1857.406 497.9886 299.0434 0.288485 2.261957 0.962943 0.938059 0.907089 307.2734 30.28902 0.000001 3615.793 230.4096 76.74329 45.60662 0.072824 0.774918 0.241059 Mean dependent var S.D. dependent var Durbin-Watson stat -0.14512 -8.061322 6.489018 6.557017 3.961422 2.918963 3.994629 0.8870 0.0000 0.0000 0.0000 0.0019 0.0129 0.0018 13677.86 1008.073 2.010131 -1.0301 0.2770 0.8229 0.3873 0.0768 0.5059 No changes in drivers or starting year from 2015 model 41
ENERGY CENTER State Utility Forecasting Group (SUFG) North Dakota Dependent Variable: ELECTRICITY_SALES Method: Least Squares Sample: 1994 2014 Included observations: 21 Elasticity at 2014 (weather at means) Variable C @MOVAV(REAL_ELECTRICITY_PRICE,3) @MOVAV(REAL_NATURAL_GAS_PRICE,3) NON_MANUFACTURING_EMP HDD R-squared Adjusted R-squared S.E. of regression F-statistic Prob(F-statistic) Coefficient -9908.14 -373.9147 164.4758 0.059875 0.335733 0.988901 0.986126 332.6993 356.3902 0.000000 Std. Error 2012.282 179.1613 62.95955 0.00196 0.123958 Mean dependent var S.D. dependent var Durbin-Watson stat t-Statistic -4.923834 -2.087029 2.612404 30.5538 2.708439 Prob. 0.0002 0.0532 0.0189 0.0000 0.0155 11173.9 2824.58 1.5623 -0.1467 0.0530 1.4298 0.2612 Changes: starting year changes from 1995 to 1994; electricity price now uses 3-year moving averages instead of 2-year moving averages 42
ENERGY CENTER State Utility Forecasting Group (SUFG) South Dakota Dependent Variable: ELECTRICITY_SALES Method: Least Squares Sample: 1995 2014 Included observations: 20 Elasticity at 2014 (weather at means) Variable Coefficient Std. Error t-Statistic Prob. C REAL_ELECTRICITY_PRICE(-2) REAL_NATURAL_GAS_PRICE(-2) POPULATION CDD HDD R-squared Adjusted R-squared S.E. of regression F-statistic Prob(F-statistic) -19621.55 -461.3775 56.99736 0.039219 0.484225 0.19127 0.997687 0.996861 92.91854 1207.911 0.000000 1128.682 77.83107 21.45578 0.000887 0.155823 0.0551 Mean dependent var S.D. dependent var Durbin-Watson stat -17.38448 -5.927934 2.656504 44.19976 3.10753 3.471316 0.0000 0.0000 0.0188 0.0000 0.0077 0.0037 9729.92 1658.558 1.833796 -0.3033 0.0310 2.7102 0.0358 0.1460 No changes in drivers or starting year from 2015 model 43
ENERGY CENTER State Utility Forecasting Group (SUFG) Texas Dependent Variable: ELECTRICITY_SALES Method: Least Squares Sample: 1996 2014 Included observations: 19 Elasticity at 2014 (weather at means) Variable Coefficient Std. Error t-Statistic Prob. C REAL_ELECTRICITY_PRICE(-2) REAL_NATURAL_GAS_PRICE(-2) REAL_GSP CDD HDD R-squared Adjusted R-squared S.E. of regression F-statistic Prob(F-statistic) 86745.8 -3684.416 2497.617 0.146033 25.49181 16.33358 0.989578 0.98557 3705.698 246.875 0.000000 17633.71 1674.161 894.5251 0.005283 4.828415 4.96877 Mean dependent var S.D. dependent var Durbin-Watson stat 4.919318 -2.200754 2.792115 27.64047 5.27954 3.287248 0.0003 0.0464 0.0153 0.0000 0.0001 0.0059 334434 30848.37 2.04072 -0.0757 0.0333 0.5461 0.2328 0.0906 No changes in drivers or starting year from 2015 model 44
ENERGY CENTER State Utility Forecasting Group (SUFG) Wisconsin Dependent Variable: ELECTRICITY_SALES Method: Least Squares Sample: 1990 2014 Included observations: 25 Elasticity at 2014 (weather at means) Variable Coefficient Std. Error t-Statistic Prob. C @MOVAV(REAL_ELECTRICITY_PRICE,3) REAL_NATURAL_GAS_PRICE REAL_GSP CDD HDD R-squared Adjusted R-squared S.E. of regression F-statistic Prob(F-statistic) 20597.33 -1299.039 257.5846 0.200844 3.974989 0.569158 0.99579 0.994682 506.5929 898.7386 0.000000 2190.601 114.4711 71.14299 0.003783 0.738156 0.251927 Mean dependent var S.D. dependent var Durbin-Watson stat 9.402594 -11.34818 3.62066 53.09825 5.385027 2.259222 0.0000 0.0000 0.0018 0.0000 0.0000 0.0358 63495.47 6946.586 1.494082 -0.1789 0.0308 0.7673 0.0376 0.0637 No changes in drivers or starting year from 2015 model 45
ENERGY CENTER State Utility Forecasting Group (SUFG) Next Steps Re-calculate the allocation models to convert state-level forecasts to LRZ level forecasts Re-calibrate LRZ energy to peak demand conversion models Incorporate econometric model drivers Run and validate state econometric models July workshop 46
ENERGY CENTER State Utility Forecasting Group (SUFG) More Next Steps Re-calibrate confidence intervals that capture uncertainty of macroeconomic variables Determine LRZ level energy and peak demand forecasts Determine MISO system energy and peak demand forecasts September workshop Develop forecast report 47