Gender Pay Gap Data Analysis at NICE - 2022/23
Delve into the gender pay gap data analysis at NICE for the reporting period of 2022/23, highlighting a mean gender pay gap of 7.36%, improvements in gender equality, disparities faced by women, and plans for further reducing the gap in 2024.

Download Presentation

Please find below an Image/Link to download the presentation.
The content on the website is provided AS IS for your information and personal use only. It may not be sold, licensed, or shared on other websites without obtaining consent from the author. Download presentation by click this link. If you encounter any issues during the download, it is possible that the publisher has removed the file from their server.
E N D
Presentation Transcript
We embrace difference Gender Pay Gap 2022/23 February 2024 1 1 1 1 1 1 1 1
Summary of NICE gender pay gap data NICE s overall mean gender pay gap for the reporting period is 7.36%, an improvement from 7.82% in 2021/22. Our data shows that women continue to be over-represented in the lowest pay quartile and under- represented in the top pay quartile. These disparities continue to be more acute for ethnic minority female staff. In summary, the data suggests that while we have made an overall improvement, we still have work to do in relation to improving gender pay disparities at NICE. This report takes a closer look at the data and also provides a summary of activity we plan to undertake in 2024 in support of further reducing the gender pay gap, and to improving gender equality more broadly at NICE. 2 2 2 2 2 2 2 2
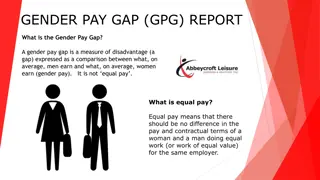
Why Gender Pay Gap reporting? UK gender pay gap (GPG) reporting is a statutory requirement which came into effect on 31 March 2017 for all employers with over 250 employees. Under this legislation, organisations are required to use defined measures to calculate and publish their pay gap. In simple terms, the gender pay gap is a measure of the difference between men s and women s average earnings across an organisation. Irrespective of our statutory obligations, collecting and analysing our gender pay gap data provides a welcome opportunity to take stock of our performance in terms of gender equality, and identify any areas where we need to see improvement. 3 3 3 3 3 3 3 3 3
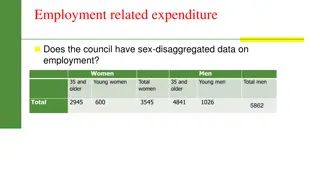
The NICE context for 2022/23 When considering NICE s gender pay gap figures, it is helpful to note the following: 67.8% of the employees included in the figures were female and 32.2% were male. In total, 836 employees (567 female, 269 male) were included in the gender pay gap (GPG) figures (in line with gender pay gap guidance those receiving less than full pay -starters, leavers, and those on maternity and sick leave- are excluded from the calculations). This year's figures include TUPE colleagues who joined on April 1, 2022. It should be noted that our GPG data is taken from ESR, the NHS workforce payroll platform. ESR does not currently provide employees with an option to identify as trans or non-binary, or to self- describe gender. It should also be noted that a number of the statistics in this report are based on small headcount numbers, meaning that the trend data can be volatile. 4 4 4 4 4 4 4 4
Our overall gender pay gap for 2022/23 Our latest gender pay gap data reveals an overall mean gender pay gap of 7.36%, in favour of male employees. How are we doing compared to the national average? What does this mean in terms of an actual pay difference? How does this compare to previous years? For every 1 that men at NICE earn, women earned 92p on average (the same as last year) There has been a slight improvement in our gender pay gap from last year, when it was 7.82% NICE s gender pay gap is consistently better than the national average, which is 14.3% for 2022/23 5 5 5 5
Other key measures for 2022/23 As a part of our gender pay gap reporting, we are also required to provide data relating to the proportion of female and male staff by pay quartile*, and the gender pay gap with regard to bonuses. Distribution of gender across pay quartiles The Bonus gender pay gap (bonuses) Women continue to be over-represented in the lowest pay quartile (75.48% of total staff) and under- represented in the upper pay quartile (59.75%) Our overall mean pay gap for bonus payments this year is 54.52%, in favour of male employees * There are 4 pay quartiles, calculated on the basis of hourly payrates, starting from the lowest paid (1st Quartile) to the highest paid (4th Quartile). 6 6 6 6
Additional findings from this reporting period Whilst it is not a statutory requirement, we also look at data relating to the distribution of gender across pay bands, internal promotions/ lateral moves, and new hires. Gender distribution across Bands New Hires Promotional prospects Females are disproportionately represented in bands 4, 5 and 6, but under-represented in most senior roles (bands 8b, 8c and 8d) Female staff had about the same chance of being promoted/ securing a lateral move (6.7%) as male counterparts The proportion of female new hires has increased from last year, to 70.31% from 63.44%, which is slightly above the overall percentage of women in the workforce 7 7 7 7
Ethnicity and the gender pay gap NICE voluntarily reports on our ethnicity pay gap. Distribution across pay quartiles - females The ethnicity pay gap Distribution across pay quartiles - males There has been a decrease from last year in the proportion of ethnic minority male staff in the highest quartile, from 35.48% to 30.48% Ethnic minority women continue to be the most over-represented group in the lowest pay quartile (40.2%) and the most under-represented in the highest quartile (14.71%). These disparities have widened since last year, when the figures were 34.48% and 16.09% respectively The current ethnicity pay gap is 13.8%, which is an increase from 11.18% last year 8 8 8 8
Disability and LGBTQ+ pay gaps For the period 2022/23, we have produced, for the first time, pay gap data for disability and sexual orientation. 5.2% (in favour of non- disabled employees) Disability This has revealed pay gaps for both groups; however, it should be noted that these are less than both the gender (7.36%) and ethnicity (13.8%) pay gaps. 3.5% (in favour of heterosexual employees) Sexual Orientation 9 9 9 9
Looking forward to 2024/25 Our key workforce EDI priorities for this financial year are set out in our 5-Year Workforce EDI Roadmap. A number of these will support our aspiration to continue to improve our gender pay gap by enabling career progression and supporting the health and wellbeing of female colleagues. They will also help us to address the pay disparities we have identified with respect to female ethnic minority colleagues. These include: A continuation of our work to embed and develop recruitment improvements introduced in 2023 The launch of a new Menopause policy (in collaboration with WIN) Our staff networks will also be engaging in further work that will help us reduce our gender pay gap. WIN will be spearheading new work to support career development for women, with a focus on those working part-time A key priority for REN is to continue to support initiatives to address employment inequalities In line with one of the key commitments of the roadmap, we will take steps to ensure all our work considers an intersectional perspective (including that relating to disabled and LGBTQ+ staff), and take action where issues are identified. 10 10 10 10 10 10 10 10 10