Sustainability Study of Coles Island School - Overview and Analysis
Comprehensive examination of sustainability aspects at Coles Island School including infrastructure planning, enrollment trends, grade level distribution, functional capacity, health, and safety evaluations. The study involves public meetings, stakeholder engagement, and adherence to Provincial Policy 409 for multi-year school development. The analysis highlights challenges and future steps for ensuring sustainable operations and educational environment.
Download Presentation

Please find below an Image/Link to download the presentation.
The content on the website is provided AS IS for your information and personal use only. It may not be sold, licensed, or shared on other websites without obtaining consent from the author. Download presentation by click this link. If you encounter any issues during the download, it is possible that the publisher has removed the file from their server.
E N D
Presentation Transcript
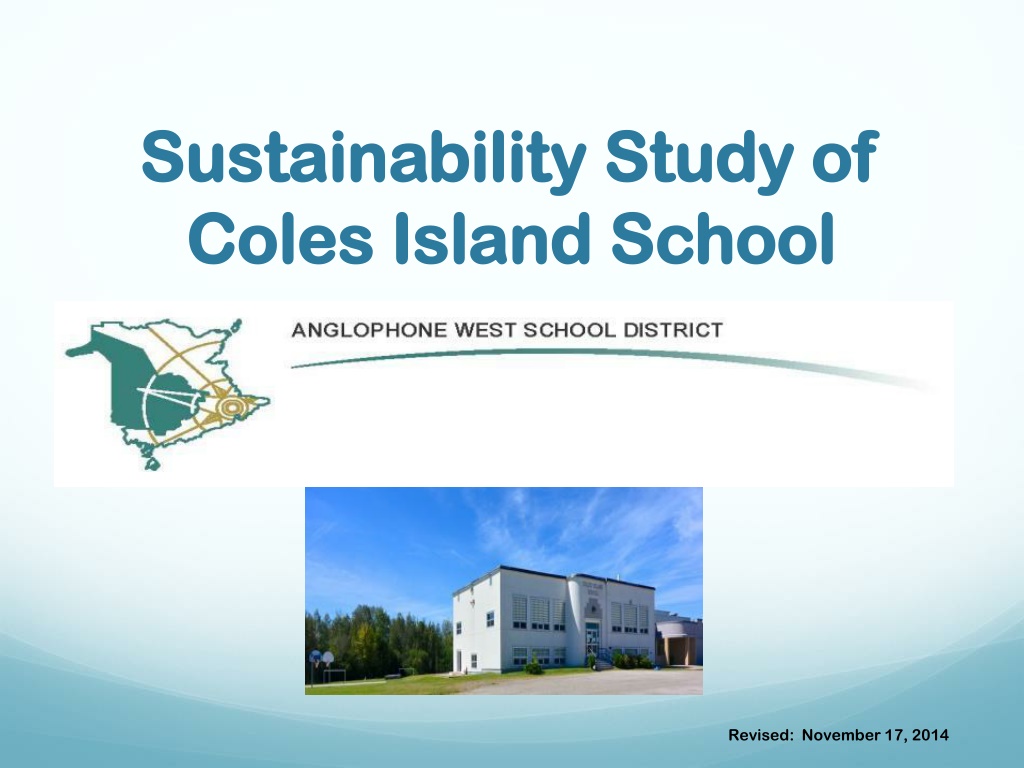
Sustainability Study of Sustainability Study of Coles Island School Coles Island School Revised: November 17, 2014
Public Meeting #1 Agenda Introductions Review of Provincial Policy 409 Multi Year School Infrastructure Planning Presentation of Facts Coles Island School Question and Answer What s Next? Online Resources and Feedback Next Meetings
Provincial Policy 409: Multi-year School Infrastructure Planning Outlines a number of responsibilities to do with facilities in our system Sections 6.4, 6.5 and 6.6 are relevant for Sustainability Studies Three Public Meetings #1 Presentation of Facts from District regarding School, in line with Policy 409 template #2 - Presentation from Stakeholders regarding their thoughts on the sustainability of the school and relevant factors #3 Final Review of Information by DEC and subsequent motion on next steps Not Designed as an Us-Against-Them process; public meetings are not designed to facilitate debate between two parties
Enrolment Enrolment
Enrolment 160 Class Size Capacity 2014 140 120 Number of Students 100 80 60 45 40 40 37 40 30 30 28 20 0 2008 2009 2010 2011 2012 2013 2014
Projected Enrolment 50 45 Number of Students 37 40 35 30 28 27 27 30 26 25 20 15 10 5 0 2012 2013 2014 2015 2016 2017
Enrolment by Grade Level 20 18 16 14 12 10 8 6 4 2 0 2008 5 9 5 11 5 5 2009 7 5 9 8 10 6 2010 4 7 3 9 7 10 2011 2 4 7 2 9 6 2012 6 2 7 9 2 11 2013 4 5 3 6 7 3 2014 4 7 4 3 5 7 K 1 2 3 4 5 K 1 2 3 4 5
Functional Capacity Student Student Enrolment Enrolment Number of Number of Classroom Classroom s s Classroom Classroom s in Use s in Use School School Capacity Capacity Capacity Capacity Rating Rating 30 6 3 144 20.8%
Health and Safety Health and Safety Building Assessment Building Assessment
Building Summary Constructed in 1957 with a wood frame structure, a wood roof and interior wood walls . Heated by electric heaters in the original part of the school and a ventilation system in the new addition. Renovations have included: 1992 Gymnasium addition The addition and removal of 2 modular classrooms
Classrooms The school was constructed with 6 classrooms. Presently: 3 classrooms are being used for classroom teaching spaces 1 classroom is being used as a resource area 1 classroom is being used as a reading center 1 classroom is used by a community playgroup
Stairwells and Corridors One phase of stairwell upgrades have been completed at the school. The main entrance stairwell remains to have an upgrade and is on the Capital Improvement Projects list.
Fire Protection A fire alarm system is installed that is monitored by National Alarm. The building does not have a sprinkler system. Fire extinguishers are located throughout the building. Fire alarm pull stations are located at the exits and throughout the school.
Domestic & Waste Water Water from a private well passes through a Sterilight ultraviolet water sterilizer, filter and water softener before entering the distribution system. Hot water is heated with a Giant Cascade 50 gallon electric hot water heater. There is a sewage treatment system located at this school.
Heating & Ventilation Electric heat throughout the original section of the school. The new section of the school (with the gym) has a ventilation system. Relies on operable windows to bring fresh air into the original portion of the school and exhausts through gravity vents found in the classrooms.
Controls & Communications Recently the controls system was replaced with new Enteliweb system from Delta. The controls are accessible remotely through the internet.
Electrical & Lighting There is a transformer that feeds power underground into the school. Fluorescent, 4 foot T12 lights in the classrooms and Hallways.
Exterior The siding is stucco finish. The windows are glass block with sliders on the bottom. 2 bottom floor classrooms have 6 foot sliding patio doors.
Property There is an entrance and an exit onto the Route 10 Highway. Staff and visitors share the school parking lot . The driveway is shared by the bus loading zone and parent drop off. There are 2 swing sets, a play structure, a ball diamond and a soccer field. There is also a small basketball court.
Capital Investments and Improvement Projects Year Year 1992 1996 2001 2003 2004 2005 2006 2008 2011 Scope of Scope of Work Gym Addition Modular Classrooms Playground Upgrade Water Softener Installation Flag Pole upgrade Fire Integrity Custodial Room upgrade Exterior Cleaning and Repair Modular Classroom Removal Work Cost Cost Unknown Unknown 2,000 2,200 8,478 4,525 6,641 5,000 642
School Physical Plant Status School Physical Plant Status Estimated Estimated Cost Cost Project Project Category Category Description Description Fire Integrity Fire Codes Stairwell enclosure at main entrance. Mechanical and Electrical Site Heating and Ventilation Ventilation system in the main portion of the school. Site Improvement Curbing and driveway refinishing. $289,000
Education Programs and Education Programs and Services Services
Education Programs and Services Provincial staffing formula calls for: 3.3 FTE for classroom teachers 0.4 FTE for administration 0.1 FTE for guidance 0.2 FTE for resource Total is 4.0 FTE teaching staff, including principal of the school Grade 5 Students from Coles Island feed into Chipman Forest Avenue School
Coles Island School Student : Teacher Ratio Total Number Total Number Student : Teacher Student : Teacher Student : Teacher Student : Teacher 2014 2014- -2015 2015 30 : 4 7.5 : 1 2013 2013- -2014 2014 28 : 4 7.0 : 1 2012 2012- -2013 2013 37 : 4 9.25 : 1 2011 2011- -2012 2012 30 : 4 7.5 : 1
K 5 Comparable Student : Teacher Ratio Total Number Total Number Student : Teacher Student : Teacher Student : Teacher Student : Teacher Chipman Chipman Elementary Elementary 104 : 8 13.0 : 1 Lincoln Elementary Lincoln Elementary 171 : 13.5 12.7 : 1 Geary Elementary Geary Elementary (extenuating (extenuating circumstances this circumstances this year) year) 161 : 13.5 11.9 : 1
Maximum class sizes Grade Level Grade Level Maximum Maximum Students Students Grade K 2 21 Grade 3 26 Grade 4 5 28 Combined K-3 16 Combined 3 5 23
Coles Island School Actual Class Sizes 2014-2015 Grade Level Grade Level Students Students K/1 K/1 11 11 K = 4, Grade 1 = 7 2/3 2/3 7 7 Grade 2 = 4, Grade 3 = 3 4/5 4/5 12 12 Grade 4 = 5, Grade 5 = 7
Comparable Class Sizes 2014-2015 Chipman Chipman Elementary Elementary K K 14 1 1 14 2 2 21 3 3 17 4 4 20 5 5 18
Comparable Class Sizes 2014-2015 Lincoln Community School Lincoln Community School K K K K 1 1 1 1 2 2 2 2 3 3 3/4 3/4 15 15 18 19 13 13 20 19 Grade 3 = 8; Grade 4 = 11 21 18 4 4 5 5
Comparable Class Sizes 2014-2015 Geary Community School Geary Community School K K 15 K K 13 1 1 17 1 1 19 2 2 16 2 2 17 3 3 20 4 4 16 5 5 28
Other Staff 1.0 Educational Assistant Administrative Assistant: 36.25 hours a week Library Assistant: 5 hours a week Cleaning staff: 40 hours a week
Delivery of Programs Physical Education offered daily to each individual grade level by the principal EST Literacy support as part of a cluster of 5 schools EST Numeracy support is provided upon request School Intervention Worker (SIW) support is available as part of a cluster of 4 schools EST Resource is onsite 0.2 designation EST Guidance is onsite 0.1 designation
Special Events and Initiatives Christmas Concert Cultural events: TNB productions, Playhouse, Kings Landing , Saint Martins Science Fair Jump Rope for Heart Reading Challenges Canteen days Enrichment clusters Coles Island School scholarships for students pursuing further education Red Cross swimming lessons Terry Fox Walk Waste Reduction Week Family picnics School wide brunch Hot lunch twice a week
Provincial Assessment Data Provincial Assessment Data
Provincial Assessment Results Grade 2 Reading Year Coles Island District Province 2009-10 66.7% 87.4% 83.6% 2010-11 100.0% 83.5% 80.3% 2011-12 57.2% 78.0% 79.1% 2012-13 50.0% 80.3% 79.5% 2013-14 Class Size too small to allow us to report 76.8% 77.5%
Provincial Assessment Results Grade 4 Reading Year Coles Island District Province 2009-10 90.0% 89.0% 83.4% 2010-11 75.0% 86.8% 80.5% 2011-12 70.0% 77.5% 77.1% Results not available after 2011-12 due to changes in the Provincial Assessment system.
Provincial Assessment Results Grade 5 Numeracy Year Coles Island District Province 2009-10 2010-11 2011-12 2012-13 2013-14 50.0% 40.0% 66.7% 50.0% NA 65.5% 64.3% 69.9% 64.0% 60.0% * 59.4% 60.8% 63.7% 62.9% 59.4% * * Based on a 20% sample of students.
Student Perception Data Based on the 2013-14 Student Perception Survey Results; 100% of students value school outcomes and see the importance of it to their future. 86% of students have both a positive sense of belonging and feel safe at their school. 71% of students have positive relationships with peers within the school. 43% of students reported that they were interested and motivated in their learning.
School Benefits Strong knowledge of individual students, as well as their strengths and needs. Small class settings create the opportunities for staff to provide one on one attention more readily. Culture of collaboration is established among staff.
School Challenges Staff in positions of responsibility are often required to teach specialty subjects and have a large percentage of time dedicated to teaching. Grade 4 students are part of a Grade 4/5 combined class, therefore scheduling needs to take this into consideration to meet the requirement of the Intensive French Program and Grade 4 curriculum. Lack of ability to consistently provide instruction by subject experts in music and PE.
Transportation Coles Island School Coles Island School 11390 Route 10 11390 Route 10 Coles Island, NB Coles Island, NB
Transportation It is important to note that currently students in grades 6-12 that reside in the Coles Island Catchment area are bussed to Chipman Forest Avenue School for secondary studies. The morning school bus system currently sees three busses transport all students within the Coles Island catchment area into the Coles Island School, where the Grade 6-12 students transfer onto one bus and proceed to Chipman Forest Avenue School.
Transportation The afternoon school bus system currently sees two busses transport the K-5 Coles Island students home. These two buses then meet the transfer bus with the 6-12 students from Chipman Forest Avenue School to deliver the students home in a timelier manner. By not sending all students (K-12) residing in the Coles Island catchment area to the same school, it is likely there would need to be an additional two school buses and drivers added to our transportation system.
Current Student Address Distances Distance to Sussex (km) 27.5 38.3 40 52.7 54.5 36.6 46 31.5 52 45.4 27.5 54.5 31.2 37.5 45.7 40.3 38.7 54 45.4 32.1 38.7 39.9 27.5 39.7 39.6 45.4 35.3 48.2 37.5 28.6 Shortest of Four Proposed(km) 22.7 24.3 16.7 25.1 27.9 20.1 19.5 26 25.3 11.3 22.7 27.9 26.2 19.2 19.8 16.5 25.9 27.3 11.3 21.5 25.9 16.7 22.7 22.8 22.9 11.3 21.4 35.5 19.2 21.9 Student 1 2 3 4 5 6 7 8 9 10 11 12 13 14 15 16 17 18 19 20 21 22 23 24 25 26 27 28 29 30 Distance to CIS (km) 6 4.9 6.6 19.3 21.1 3.2 12.6 10.4 18.5 12 6 21.1 10.2 4 12.2 6.8 5.2 20.5 12 1.4 5.2 6.5 6 6.3 6.2 12 1.9 14.8 4 4.9 Distance to CES (km) 49.5 38.7 44.3 25.1 29 43.7 30.9 53.9 31.6 49.3 49.5 29 53.7 42.8 31.3 44.5 41.6 29.6 49.3 44.9 41.6 44.2 49.5 37.2 37.3 49.3 42.8 42.6 42.8 48.4 Distance to CNS (km) 22.7 24.3 16.7 26.1 27.9 20.1 19.5 26 25.3 11.3 22.7 27.9 26.2 19.2 19.8 16.5 25.9 27.3 11.3 21.5 25.9 16.7 22.7 22.8 22.9 11.3 21.4 35.5 19.2 21.9 Distance to Havelock (km) 50 60.3 62.6 75.3 77.1 59.2 68.6 54 74.5 68 50 77.1 53.8 60 68.3 62.8 61.2 76.5 68 54.7 61.2 62.5 50 62.3 62.2 68 57.9 70.8 60 51.2 Minimum Distance 1.4 Minimum Distance 11.3 Maximum Distance 21.1 Maximum Distance 35.5 Average Distance 9.4 Average Distance 21.9
Approximate Bus Riding Times Distance 1-way from CIS Longest Ride In Longest Ride Out Earliest Pick-Up Latest Drop- Off School Sussex Elementary School 40km 1h 19min 1h 19min 6:51 3:44 Cambridge Narrows School 23km 1h 5min 1h 5min 7:10 4:05 Chipman Elementary School 43km 1h 21min 1h 21min 6:59 4:21 Havelock Elementary School 60km 1h 36 min 1h 36 min 6:39 4:36 Coles Island School - 45min 45min 7:00 AM 3:20 PM
Salaries Actual Costs Actual Costs Fiscal Year Fiscal Year 2012 2012- -2013 2013 Cost Centers Cost Centers Fiscal Year Fiscal Year 2013 2013- -2014 Fiscal Year Fiscal Year 2011 2011- -2012 2014 2012 Salaries Salaries Administration 17,309 12,742 12,740 Teacher Admin.Assist/Library Assist 317,946 282,756 277,412 28,307 27,258 26,604 Teacher Assistant 27,066 40,845 39,153 Custodian 34,765 34,436 33,754 Total Total 425,393 425,393 398,037 398,037 389,664 389,664
