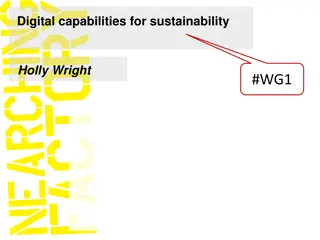
GIS and Sustainability Lesson Ideas for KS3 on Colouring London
Explore how Colouring London aims to make the city more sustainable by collecting information on every building. Engage students in discussions about sustainability, data collection, and use of GIS for mapping sustainability. Encourage hands-on fieldwork and online research to gather primary and secondary data, fostering a deeper understanding of urban sustainability concepts.

Download Presentation

Please find below an Image/Link to download the presentation.
The content on the website is provided AS IS for your information and personal use only. It may not be sold, licensed, or shared on other websites without obtaining consent from the author. Download presentation by click this link. If you encounter any issues during the download, it is possible that the publisher has removed the file from their server.
E N D
Presentation Transcript
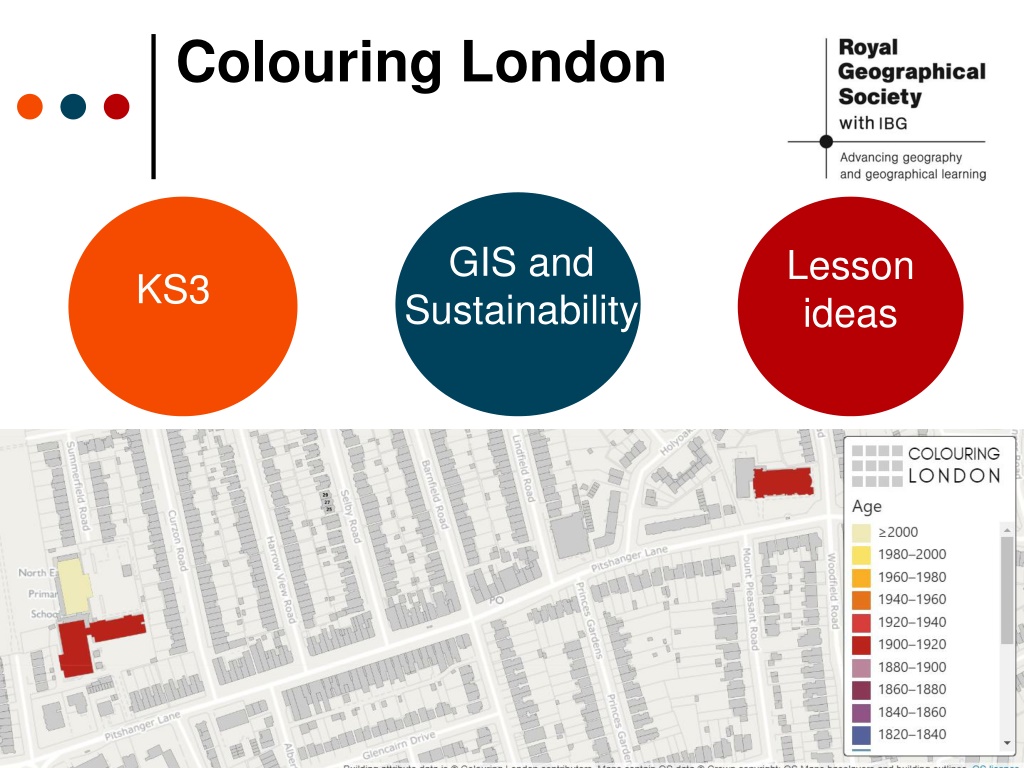
Colouring London GIS and Sustainability Lesson ideas KS3
Colouring London Colouring London aims to collect information on every building in London, to help make the city more sustainable. It provides information about your local area https://colouringlondon.org/
What information should I collect? Thinking hats task Divide into groups of 6 to discuss the following two questions: What does sustainability mean? What information could you collect about a building that might tell us about how sustainable it is?
The Thinking Hats White Hat Data and information Red Hat Feelings and intuition Yellow Hat Positive view Black Hat Critical approach Green Hat Creative thinking Blue Hat Summaries and conclusions
Findings Write your class ideas into the bubble below
Findings Suggestions How old the building? Is the building empty/unoccupied? What is the building used for? Is the building made of bricks? How many windows does the building have?
What information should you collect? Colouring London would like to collect Location Land use Type Age Size & Shape Construction Streetscape Team https://www.pages.colouring.london/buildingcategories
How could I collect this information? Primary data Carry out some local fieldwork Add data directly into Colouring London or return to school and your teacher can add the data to the Colouring London website Secondary data Use Google Earth or Streetview Use websites such as Historic England or Survey of London
How can GIS be used to map sustainability? What is GIS? Geographical Information Systems provide a framework for gathering, managing, and analysing data.
Collecting primary and secondary data Write 1-3 key questions Choose 1-2 streets near school to survey Print out a map of your streets (Digimap for schools) Design a colour coding system to record on your printed map
Example study Ealing, London W5 Key questions: 1. Are younger buildings more sustainable than older buildings? 2. Are high rise buildings more sustainable than low rise buildings? 3. Are concrete buildings more sustainable than brick buildings? For the purposes of this example, building age, type and height along with energy efficiency certificates as the measure for sustainability.
Maps of study area School
Designing a key - examples Sustainability (DEC rating) Type DT = Detached SD = Semi-detached ET = End of terrace MT = Mid terrace F = Flat/apartment A B C D E F G Size and shape (Storeys) How many storeys between the pavement and start of roof? 1 = Ground floor only 2 = Ground and first floor etc. Think about the codes that you use. On a paper map it would not be possible to use several colours on one building as they have done on the Colouring London platform
Primary data collection Primary data collection is information that you collect yourself e.g. tallies, taking photographs or measurements For this example you can walk along a street near your school and on your map, record the building age, type and how many storeys the building has.
Risk assessment Before you collect any data, think about your safety and the risks. Your school will have a clear policy on carrying out a risk assessment before embarking on any fieldwork. Please refer to this and for further information please visit the RGS-IBG Fieldwork safety and planning pages.
Recording your data in the field
Collecting secondary data Secondary data is data that has been collected by someone else and made available e.g. government statistics from the Census In this example we are using Energy Performance Certificates. Any premises sold or rented is required to have an EPC to show how energy efficient it is. Only buildings rate grade E or higher maybe rented. This data is free and available for public use.
Obtaining data on energy performance Using the CDRC database, you can look up EPC data for your local area https://maps.cdrc.ac.uk/#/metrics/epc_current
Answering your questions 1. Are younger buildings more energy efficient than older buildings? Buildings constructed between 1910-1930 in Ealing have an average EPC rating E (39-54) which is worse than the built in the 1960 s which have an average EPC rating of C (69- 80) suggesting that older buildings are less sustainable than younger buildings.
Answering your questions 2. Are high rise buildings more sustainable than low rise buildings? High rise (greater than 4 storeys) buildings in Ealing have an average EPC rating B (81-91) compared with low rise (2 storeys) which have an average EPC rating of D (55-68) suggesting that high rise buildings are more sustainable than low rise buildings.
Answering your questions 3. Are concrete buildings more sustainable than brick buildings? Concrete buildings in Ealing have an average EPC rating B (81-91) compared with brick buildings have an average EPC rating of D (55- 68) suggesting that concrete buildings are more sustainable than brick buildings.