Analyzing Farm Transition Success Strategies - Thesis Presentation
Analyzing the rate of success of alternative farm transition strategies is crucial for ensuring the long-term viability and financial security of agricultural operations. This presentation delves into the importance of farm transition planning, challenges faced, reasons for failure, and the development of a model to enhance the success rate of farm asset transfers.

Uploaded on Oct 08, 2024 | 0 Views
Download Presentation

Please find below an Image/Link to download the presentation.
The content on the website is provided AS IS for your information and personal use only. It may not be sold, licensed, or shared on other websites without obtaining consent from the author. Download presentation by click this link. If you encounter any issues during the download, it is possible that the publisher has removed the file from their server.
E N D
Presentation Transcript
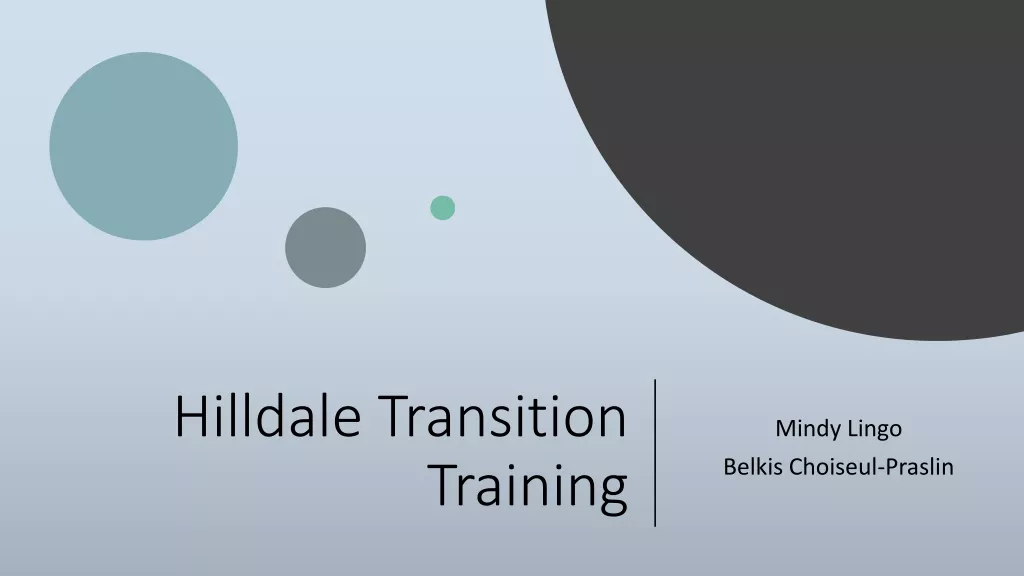
Assessing the Rate of Success of Alternative Farm Transition Strategies GARRETT JAMES REED THESIS PRESENTATION AND DEFENSE OKLAHOMA STATE UNIVERSITY
Committee Members Dr. Shannon Ferrell (Advisor) Dr. Rodney Jones Dr. Eric DeVuyst
Also a Special Thanks To J.C. Hobbs Dr. John Michael Riley Mike Schrammel Joe Kreger & Luke Werth Jimmy Harmon & Loryn Schnaithman
What is farm transition planning? The process of transferring farm assets ownership and management to the next generation of farm operators Encompasses: Estate planning (wills, trusts, estates, etc.) Retirement planning for the preceding generation Farm business management
Why is this important? 30% transfer from 1stgeneration to 2ndgeneration 12% transfer from 2ndgeneration to 3rdgeneration 3% transfer from 3rdgeneration to 4thgeneration .. Well documented goals of many farmers (Kirkpatrick 2013) Long-term viability of the farm Financial security for the founding generation Keeping the farm within the family
Why is this important? Survey of Minnesota Farmers conducted by Hachfeld et al. 2009 524 workshop attendees, 296 completed surveys 57.8% did not have an up-to-date estate plan 88.9% did not have an up-to-date farm transfer plan Finding time to complete the process Difficulty developing goals Lack of family consensus/disagreements Difficulty finding the professionals Parents not ready to give up control
Why do farm transitions fail? Spafford (2006) Inadequate estate planning Insufficient capitalization Failure to prepare the next generation properly
Purpose Statement Develop a model that will allow researchers and extension educators to simulate alternative farm transition strategies in an effort to increase the success rate of farm asset transfers.
Objectives Determine the ability of the farm s cash flow, supplemented by the financial resources of the operating stakeholders, to support a given alternative farm transition strategy over a 20-year planning horizon. Commercial loan Seller financing Sinking fund investment Second-to-die whole life insurance policy Lifetime farm business transfer
Objectives Determine the probability of a successful farm transition using the aforementioned alternative strategies above subject to time, equity, and cash flow constraints. Provide educational examples and tools to support farm transition research and educational efforts.
Representative Farm Wanted results to be applicable to a broad range of farm owners Commercially viable, 1.0 FTE farm Mom, Dad, Farm Heir, Off-Farm Heir Largely used KFMA data and farm financial ratios
Representative Farm Net farm income: $100,000 Family living expense: $70,000 Off-farm income: $44,356 Value of farm production: $660,000 Total assets: $3,300,000 Total debt: $660,000 50% income from cattle, 50% income from crops Owns 1,146 acres, leases 2,539 acres
Representative Farm Table 1. Balance Sheet Assets Liabilities Breeding Livestock $408,784 Long-Term Debt $660,000 Equipment $500,000 Total Liabilities $660,000 Total Operational Assets $908,784 Buildings $100,000 Owner s Equity $2,640,000 Land $2,291,216 Total Liabilities and Total Assets $3,300,000 Owner s Equity $3,300,000
Representative Farm Family All live (and die) on the averages Mom: 58, passes away at 81 Dad: 58, passes away at 76 Farm Heir: 32 at start of transition Off-Farm Heir: 30 at start of transition
Alternative Strategies Strategy 1: Split Down the Middle Strategy 2: Grow to Equal Strategy 3: Estate Balancing Strategy 4: Sweat Equity Recognition/Discount Strategy 5: Lifetime Farm Business Transfer
Strategy 1: Split Down the Middle Undivided interests are given to both heirs Most common when: No plan is in place We ll let you kids sort it out! Assume Off-Farm Heir demands a buyout Two options: Commercial Loan Seller Financing
Strategy 1a: Commercial Loan Cattle 5 years at 5.75% Annual payment $38,554 Equipment 5 years at 5.75% Annual payment $47,157 Real Estate 20 years at 6.5% Annual payment $86,807
Strategy 1b: Seller Financing Financing with Off-Farm Heir All three notes combined into one 20 years at 3.05% (Applicable Federal Rate) Annual payment $89,135
Strategy 2: Grow to Equal Farm Heir inherits all of the farm assets Mom and Dad create a financial asset to equal the value of the farm asset base Two options: Sinking investment fund Second-to-die whole life insurance policy
Strategy 2a: Sinking Investment Fund Total asset value: $3,300,000 After-tax, real rate of return: 4.55% Pay period: 20 years Annual payment: $104,642
Strategy 2b: Life Insurance Total asset value: $3,300,000 Proxy rate of return: 9% Pay period: 20 years Annual premium: $64,503
Strategy 3: Estate Balancing Farm operating assets and farm land are placed in separate entities, respectively Farm Heir inherits the operating entity Farm Heir and Off-Farm Heir receives equal interests in land entity Operating entity pays FMV rents to land entity Entity distributes income to Farm Heir and Off-Farm Heir
Strategy 3: Estate Balancing Mom and Dad create a financial asset to equal the value of the operating entity Off-Farm Heir inherits the financial asset Two options: Sinking investment fund Second-to-die whole life insurance policy
Strategy 3a: Sinking Investment Fund Operating entity value: $908,784 After-tax, real rate of return: 4.55% Pay period: 20 years Annual payment: $28,817
Strategy 3b: Life Insurance Operating entity value: $908,784 Proxy rate of return: 9% Pay period: 20 years Annual premium: $17,764
Strategy 4: Sweat Equity Recognition/Discount Similar to Strategy 3 Farm operating assets and farm land are placed in separate entities, respectively Farm Heir inherits the operating entity Farm Heir and Off-Farm Heir receives equal interests in land entity Operating entity pays FMV rents to land entity Entity distributed income to Farm Heir and Off-Farm Heir
Strategy 4: Sweat Equity Recognition/Discount Mom and Dad create a financial asset to equal the value of the operating entity Off-Farm Heir inherits the financial asset Recognize Farm Heir s contribution to grow farm assets Two options: Sinking investment fund Second-to-die whole life insurance policy
Strategy 4a: Sinking Investment Fund Operating entity value: $454,392 After-tax, real rate of return: 4.55% Pay period: 20 years Annual payment: $14,409
Strategy 4b: Life Insurance Operating entity value: $545,139 Proxy rate of return: 9% Pay period: 20 years Annual premium: $8,882
Strategy 5: Lifetime Farm Business Transfer Farm operating assets and farm land are placed in separate entities, respectively Farm Heir receives annual salary of $42,000 Farm Heir purchases shares of the operating entity each year Farm Heir receives a larger portion of farm income as well as farm debt with each additional share In years when Farm Heir has insufficient funds to purchase a full share, Mom and Dad gift the difference
Strategy 5: Lifetime Farm Business Transfer At the end of the transfer, Farm Heir and Off-Farm Heir receive equal interests in land entity Operating entity pays FMV rents to land entity Entity distributes income to Farm Heir and Off-Farm Heir Any excess funds would then be split between Farm Heir and Off-Farm Heir Net any gifts Farm Heir received to help fund this transition
Strategy 5: Lifetime Farm Business Transfer Operating entity value: $908,784 Planning horizon: 20 years Annual purchase: 5% Annual entity payment from Farm Heir: $45,439 Annual gift to Farm Heir: Variable ($45,439-Entity payment)
Conceptual Framework ???????? ??????????? ??? ??? ?????(?????????) > 0 ?????????{1, ,5}
Equations 1 ??? ???? ?????? = ??? ???? ?????? ?????? ???????? ?????????? ???????? ??????? 2 ???? ?????????? ??? = 0.153 ??? ???? ?????? 3 ???????? ????? ?????? = ??? ???? ?????? ???? ?????????? ??? 4 ??????? ?????? = ???????? ????? ?????? 24,000 0.20 ??? ???? ?????? (0.50 ???? ?????????? ???) 5 ??????? ?????? ??? = ??????? ?????? ??????? ????? ????? ?????? ??? ???? 6 ??? ???? = ??? ???? ?????? + ??? ???? ?????? ?????? ?????? ??????? ??????? ?????? ??? ????????? ???????? 7 ??? ??? ???? = ??? ???? ??????????? ??????? ??? ???? ??????
Criteria 1. If the debt to asset ratio ever reaches 0.60 2. If the farm incurs three consecutive years of unpaid operating debt 3. If the farm ever incurs any operating debt 4. Only for scenario 5, if the cash reserves of Mom and Dad is ever less than 0
KFMA Income Data 2005-2017 from KFMA Southeast Association Adjusted to real dollars using a CPI Index Coefficient of variation (relative variability): 0.4112 Mean $100,000 Standard Deviation: $41,118
Monte Carlo Simulation Given the farm s mean income and standard deviation, a Monte Carlo simulation is used Determines a normally distributed, random draw in farm income Applies variability and risk to farm income One 20-year planning horizon is 1 iteration
Monte Carlo Simulation Each strategy is imposed on model farm Simulated 500 times Each failure within one 20-year iteration is reported by a 1, subject to the criteria Adding up the number of fails reported by a 1 and dividing by the total number of iterations provides the probability of failure Subtracting this number from 1 gives the probability of success
Results Table 2. Alternative Strategies Probability of Success Strategy D/A Ratio < 0.60 Op. Debt < 3 years No Op. Debt Cash Reserves >0 1(a) 1% 0% 1(b) 100% 4% 2(a) 100% 0% 2(b) 100% 1% 3(a) 100% 96% 3(b) 100% 100% 4(a) 100% 100% 4(b) 100% 100% 5 100% N/A 0% 0% 0% 1% 89% 97% 97% 99% N/A N/A N/A N/A N/A N/A N/A N/A N/A 99%
Strategy 1a: Commercial Loan Criteria 1. 1% success 2. 0% success 3. 0% success
Strategy 1b: Seller Financing Criteria 1. 100% success 2. 4% success 3. 0% success
Strategy 2a: Sinking Investment Fund Criteria 1. 100% success 2. 0% success 3. 0% success
Strategy 2b: Life Insurance Criteria 1. 100% success 2. 1% success 3. 1% success
Strategy 3a: Sinking Investment Fund Criteria 1. 100% success 2. 96% success 3. 89% success Met at $140,000
Strategy 3b: Life Insurance Criteria 1. 100% success 2. 100% success 3. 97% success Met at $130,000
Strategy 4a: Sinking Investment Fund Criteria 1. 100% success 2. 100% success 3. 97% success Met at $120,000
Strategy 4b: Life Insurance Criteria 1. 100% success 2. 100% success 3. 99% success Met at $120,000