Understanding Three-Phase Relative Permeabilities in Reservoir Engineering
Explore the application, correlations, and traditional assumptions of three-phase relative permeabilities in reservoir engineering. Learn about saturation-dependencies, occupancy models, and the challenges of measuring three-phase relative permeabilities. Discover how to calculate three-phase permeabilities from two-phase data and the key considerations in EOR projects.

Download Presentation

Please find below an Image/Link to download the presentation.
The content on the website is provided AS IS for your information and personal use only. It may not be sold, licensed, or shared on other websites without obtaining consent from the author. Download presentation by click this link. If you encounter any issues during the download, it is possible that the publisher has removed the file from their server.
E N D
Presentation Transcript
Three Phase Relative Permeability
Outline Application of 3-phase relative permeabilities Saturation-dependencies of 3-phase relative permeabilities Occupancies and filling sequences Dependency regions Probabilistic model Ternary diagram Iso-relative permeabilities (isoperm) Modeling of three phase relative permeability
Application of 3-phase relperm Main application in EOR projects, WAG, SWAG, etc. Equilibrium gas or separator gas injection. 3-phase relperm measurement is difficult, expensive and time consuming. Two phase data is much more available. Many methods have been developed to calculate three phase relative permeability from two phase curves (water/oil curve and oil/gas curve).
Relative Permeability Correlations Lab measurements Two phase system Three phase system Stone 1 and 2 models Corey s model Stone 1 Scaling technique Input two sets of rel perm data krow,krw=f(Sw) krog,krg=f(Sg) Find kro=f(Sw,Sg) Stone 2 Does not require Sor Find kro=f(Sw,Sg)
3-Phase relative permeabilities Traditional assumptions for saturation-dependencies krw(Sw), krg(Sg), kro(Sw,Sg) Which is based on simple pore scale view of pore occupancy
3-Phase relative permeabilities Traditional assumptions for saturation-dependencies krw(Sw), krg(Sg), kro(Sw,Sg) Water-wet system: Water in small pores, gas in big pores, oil in between
3-Phase relative permeabilities Similar to water-oil system, water occupancy depends only on water saturation, therfore krw(Sw)
3-Phase relative permeabilities Similar to gas-oil system, gas occupancy depends only on gas saturation, therfore krg(Sg)
3-Phase relative permeabilities Oil is in contact with water and gas. Therefore oil occupancy depends on gas and water occupancy. kro(Sg,Sw)
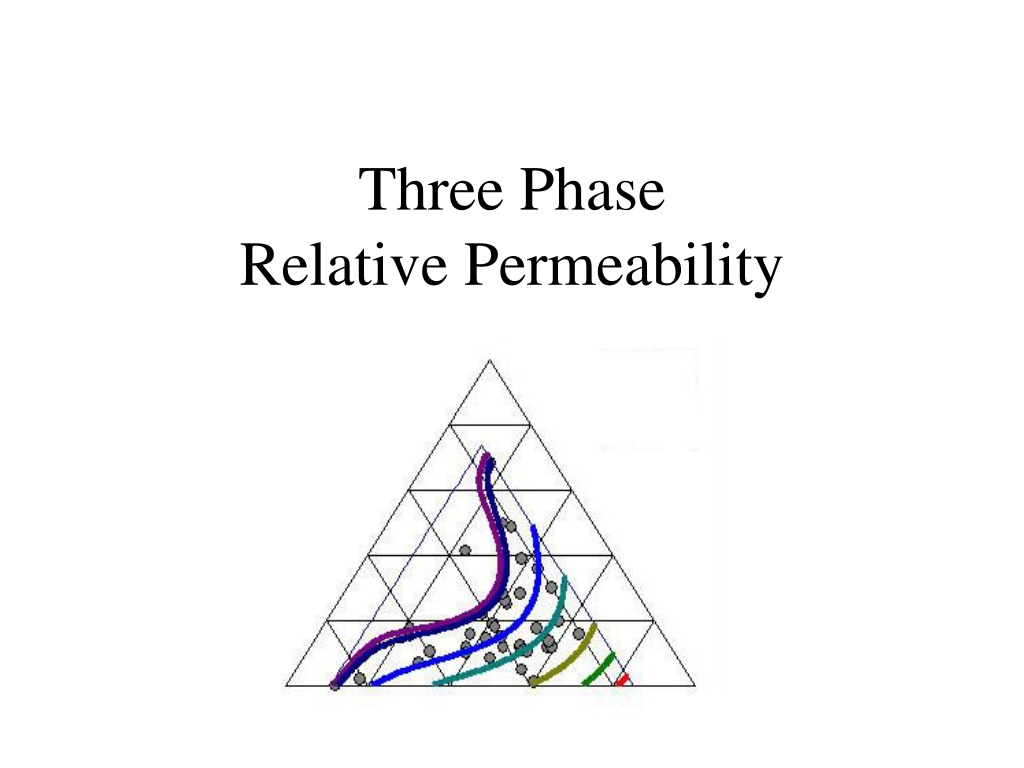
Ternary Diagram Plot Point for: Sw=0.25 So=0.40 Sg=0.35 0.00 So 1.00
Iso-relative permeabilities (isoperm) Lines show constant kro (isoperm) Not parallel to any saturation lines krois a function of both water and gas saturation Pore size distribution Water: smallest Gas: largest Oil: intermediate pores
Iso-relative permeabilities (isoperm) Lines show constant krg (isoperm). Approximately parallel to gas saturation lines Krg is a function of gas saturation Gas is in largest pores
Stone model 1 Proposed method by Stone in 1970 So Sor 1 Swir Sor SoD= krow ??= 1 SwD Sw Swir 1 Swir Sor kro= SoD.??.?? SwD= krog ??= 1 SgD Sg SgD= 1 Swir Sor Sor: residual oil saturation Swir: irreducible water saturation
Stone model 2 Stone's model 2 is a modified version of Stone 1. It is a better predictor than Stone 1 in high- oil saturation regions. It is more appropriate for water-wet systems and is not suited for intermediate wet systems. ???= ????+ ??? ????+ ??? (??? + ???)


")
")