Understanding Price Indices: Introduction, Purpose, and Use
Price indices play a crucial role in measuring changes in purchasing power, inflation, and real values over time. This module provides an in-depth look at price indices, including their definition, key uses, and importance in economic and business contexts. From explaining what price indices are to their practical applications in calculating national account statistics and adjusting wages, this comprehensive guide sheds light on the significance of these indices in today's economy.

Download Presentation

Please find below an Image/Link to download the presentation.
The content on the website is provided AS IS for your information and personal use only. It may not be sold, licensed, or shared on other websites without obtaining consent from the author. Download presentation by click this link. If you encounter any issues during the download, it is possible that the publisher has removed the file from their server.
E N D
Presentation Transcript
Module 16: Price Index Session I
Contents Session I Introduction purpose and use of Price Index What is an Index number Aggregate index 2
Introduction Purpose and Use What is Price Index? Main uses Common price indices
Price Index an Introduction Price The price of a product whether goods or services is simply defined as the value of one unit of that good or service. Prices are observable in monetary transactions. Prices are generally determined on a market. Wages are also considered as price of the factor service labour . The price of each good or service is made up of several cost factors. 4
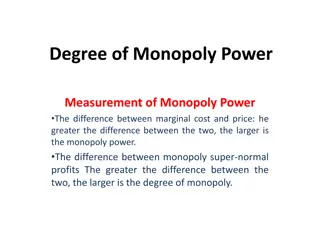
Price Index an Introduction Price Index Of all the index numbers, price indices are the most important and are commonly used in various economic and business contexts. Price index compares the prices of a group of commodities at a certain time or place with prices of the base period or place, respectively. 5
Price Index an Introduction What are Price Indices? A price index compares the prices of a set of products at different points in time, or at different locations. It therefore measures price changes or price differentials rather than price levels. Price indices capture changes in prices of a set of goods & servicesactually paid or received, at different stages of distribution, such as: price paid by the customer (CPI) or price received by the producer (output PPI). 6 6
Price Index an Introduction Main Purpose As the price level goes up, the value of money goes down. The main purpose of compiling a price index is to measure the change in purchasing power of the economy s currency with respect to the specified group of goods and services purchased or sold by a specified type of purchasers or sellers. 7 7
Price Index an Introduction Use of Price Indices Main uses: Measurement of inflation changes in general level of prices over time. Calculation of real values National Accounts Statistics at constant prices. Calculation of indexed values adjustment of wages & salaries. Contract escalation. Determination of foreign exchange rates and for International studies. 8 8
Price Index an Introduction Prices change in stage of economic process Often case: P P Final consum ption P Retail Wholesale P Final Products P Intermediate outputs Raw materials 9
Price Index an Introduction Different Price Indices There are different kinds of price indexes. For each different stage of processing price indices are compiled. These differ with respect to items they take into account. buyers or sellers involved in the transactions. periodicity, i.e. whether the prices are observed weekly or monthly or yearly. 10 10
Price Index an Introduction Common Price Indices Principal Price indices Consumer Price (CPI) Producer Price Indices (PPI): input PPI and output PPI Services Producer Price Indices like BSPI & CSPI and CGPI Import and Export Price Indices (XMPI) Purchasing Power Parity (PPP) GDP implicit price index or GDP deflator Others Labour Cost Index wage rate index Energy Price Statistics Construction Cost Index House rent index often part of CPI 11 11
Price Index an Introduction Price Index in this module Of the various price indices mentioned in the previous slide, this module focusses on mainly on CPI. The PPI and XMPI are also discussed briefly, especially in the context of weighting, product classification and interpretation. We will start with a discussion on Index numbers in general, before turning to Price indices. 12
What is an Index Number Simple price index Types of simple price index
Index number Definition: Index numbers Definition:Index numbers are statistical devices designed to measure relative changes in the level of a phenomenon (variable or a group of variables) with respect to time, or geographical location or other characteristics such as income, profession, etc. Index numbers measure magnitude of change. We will discuss index numbers for changes with respect to time. 14
Index number Index numbers - Examples The variable may be - price of a particular commodity or a group of commodities - volume of trade, imports and exports, agricultural or industrial production, etc. - Human and livestock population - national income of a country or - cost of living of persons belonging to particular income group/profession, etc. 15
Index number Types of Indices Types of indices Simple index number Simple aggregate index Weighted aggregate index. We begin by considering the simplest form of index numbers, simple indices . In the context of price index, the simple indices are called price relatives . 16
Simple Index Definition: Simple Index Formally, a simple index number or an elementary index It of a variable Y is defined as y = t ( ) 100 I t y 0 where : Index in the current period of item I t Value : of one unit in the period t y t Value : of one unit in the base period y 0 18
Simple Index Index number: Examples Year TShs per Index Example 1: The average exchange rate of Tanzanian shillings (TShs) to US dollars (US$) for each year is converted into index numbers with the year 2000 as a base year as follows: US$ 2000=100 2000 800.7 100.0 2001 876.4 109.5 2002 966.6 120.7 2003 1038.6 129.7 Find out the value of the index for 2005. 2004 1089.3 136.0 2005 1128.8 ? 19
Simple Index Rule of three The rule of three is a very useful procedure when deriving index numbers from a series of statistics. The value in the cell D is worked out as follows: Index Year TShs per US$ (2000=100) D = B*C/A = 100*1128.8/800.7 = 141.0 2000A 800.7B 100.0 2001 876.4 109.5 2002 966.6 120.7 2003 1038.6 129.7 2004 1089.3 136.0 2005 C 1128.8 D ? 20
Simple Index Index number: Examples Example 2: The population of Zambia each year may be converted into index numbers with the year 2000 as a base year as follows: Index Year Population 2000=100 2000 9,885,591 100.0 2001 10,089,492 102.1 2002 10,409,441 105.3 2003 10,744,380 108.7 2004 11,089,691 112.2 2005 11,441,461 115.7 2006 11,798,678 119.4 2007 12,160,516 ? 21
Simple Index Index number: Examples Year Price of tea leaves per Kg. Elementary Index (2000=100) Example 3: The average price (in a local currency) of tea leaves (of a particular kind) for each year is given in the following table. These when converted to index numbers with the year 2000 as a base year are the elementary indices or price relatives : 2010 1500 100.0 2011 1550 103.3 2012 1620 108.0 2013 1710 114.0 2014 1850 123.3 2015 2000 ? 22
Simple Index A few questions Exercise 1 Fill in the missing index numbers in the boxes with a ? mark answer the following: By what percentage has the 2007 population of Zambia has grown since the year 2000? By how much (in percentage) TShs to US$exchange rate has increased during 2000 to 2004? What is the price relative of tea leaves in 2015 with respect to 1010? 23
Aggregate Index numbers Why index numbers? Indices of the elementary kind, discussed above, have little value in themselves. But they can be used to compile more complex composite indices, involving many different goods and services. In economic statistics, the term index numbers is usually reserved for these more complex composite indices. 25
Aggregate Index numbers Need for Composite Index numbers When there is only one product, the elementary index (discussed above) serves well as a measure of change in price of the product or volume of its production. Further, when there is a whole variety of products, with prices and volume of production / consumption changing at different rates, one can measure the change in money value of production / consumption by a single indicator, as shown in the next slide. 26
Aggregate Index numbers Measuring change in value ? ?=1 ?=1 ?????? ?0? ?0? 100 ?0?= ? where qti represents quantity of ith product in tth period pti represents price of ith product in tth period q0i represents quantity of ith product in base period p0i represents price of ith product in base period This is simply the ratio between the total (money) value in the current period (tth) and that in the base period. This is called value index in the rest of the presentation. 27
Aggregate Index numbers Decomposing V0t Change in value: V0t But how to separate out the change in value between changes in price and changes in quantity? Constructing composite Index numbers becomes essential for measuring separately the change in prices or that in volume. This leads to what is known as the Index Number Problem 28
Aggregate Index numbers Index Number Problem (1) How to combine the relative changes in the prices and quantities of various products into a single measure of the relative change of the overall price level and quantity level. 29
Aggregate Index numbers Index Number Problem (2) Or, conversely, how a value ratio pertaining to two periods of time can be decomposed into a component that measures the overall change in prices between the two periods the price index a component that measures the overall change in quantities between the two periods the quantity (volume) index. There is no unique way to achieve this. and 30
Composite Index numbers Types of composite indices There are only two types of composite indices, (because value indices are always simple relatives or ratios of value): Price indices Quantity (or volume) indices Quantity and volume are synonyms here. In economic statistics, changes in quality are considered as changes in quantity and included with them. Usually the index is assigned a value of 100 in some selected base period. The values of the index for other periods indicate the average percentage change (in prices or quantities) from the base period. 31
Composite Index numbers Price and Quantity Index A price index reflects the average of the proportionate changes (%) in the prices of the specified set of goods and services between two periods of time. A quantity index reflects the average of the proportionate changes (%) in the quantities of the specified set of goods and services between two periods of time. For the rest of this module, we will focus on Price Index only. 32