Exploring Renewable Energy Technologies for a Sustainable Future

This collection of images showcases different renewable energy technologies such as waste-to-energy, geothermal, solar, and wind energy. It delves into concentrated solar power, photovoltaics, CSP plants, on-shore and off-shore wind energy, and various power plant types. The visuals highlight the importance of sustainable energy sources in shaping our future towards environmental sustainability.

Uploaded on Sep 17, 2024 | 0 Views
Download Presentation

Please find below an Image/Link to download the presentation.
The content on the website is provided AS IS for your information and personal use only. It may not be sold, licensed, or shared on other websites without obtaining consent from the author. Download presentation by click this link. If you encounter any issues during the download, it is possible that the publisher has removed the file from their server.
E N D
Presentation Transcript
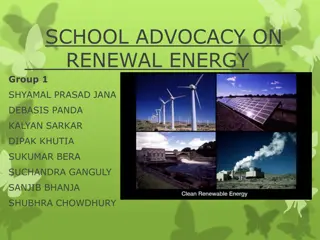
This is The Future Sustainability
Renewable Energy Technologies Waste Waste To To Energy Energy Geothermal Geothermal Energy Energy Solar Energy Solar Energy Wind Energy Wind Energy
Renewable Energy Technologies Waste Waste To To Energy Energy Geothermal Geothermal Energy Energy Solar Energy Solar Energy Wind Energy Wind Energy Concentrated Solar Power Photovoltaic Concentrated Photovoltaic 4
Renewable Energy Technologies Concentrated Concentrated Solar Power Solar Power Concentrated Concentrated Photovoltaic Photovoltaic Photovoltaic Photovoltaic Tower Low concentration CPV Medium concentration CPV High concentration photovoltaics (HCPV) Moncrystalline Polycrystalline Amorphous Parabolic Trough Linear Fresnel Stirling Dish 5
Consternated Solar Power Parabolic Trough Parabolic Trough Tower Tower Powet Powet 7
CSP Plants Shams Shams 1 1, , 100 100MW, UAE MW, UAE Ivanpah Ivanpah, , 392 392MW, USA MW, USA 8
Renewable Energy Technologies Waste Waste To To Energy Energy Geothermal Geothermal Energy Energy Solar Energy Solar Energy Wind Energy Wind Energy On-Shore Off-Shore 9
Wind Energy On On- -Shore Shore Off Off- -shore shore refers to the construction of wind farms in bodies of water refers to the construction of wind farms in land 10
Renewable Energy Technologies Waste Waste To To Energy Energy Geothermal Geothermal Energy Energy Solar Energy Solar Energy Wind Energy Wind Energy Dry Steam Power Plant Flash Steam Power Plant Binary Steam Power Plant 11
Geothermal Energy Flash Steam Power Flash Steam Power Plant Plant Binary Steam Power Binary Steam Power Plant Plant Dry Steam Power Plant Dry Steam Power Plant 12
Renewable Energy Technologies Waste Waste To To Energy Energy Geothermal Geothermal Energy Energy Solar Energy Solar Energy Wind Energy Wind Energy Physical Thermal Biological 13
Market Outlook Is there a market Is there a market
Estimated Renewable Energy Share of Global Electricity Production, End-2016 Non-renewable electricity 75.5 75.5% % Wind Power 4.0% 4.0% Hydropower 16.6% 16.6% Bio Power 2.0 2.0% % Renewable Electricity 24.5 24.5% % Solar PV 1.5 1.5% % Ocean, CSP and Geothermal Power 0.4 0.4% % 921 921 GW GW Renewable Energy Renewable Energy
Screenshot of the World Renewable Energy Capacity, Top Countries, 2016 Germany 98 GW Japan 51 GW Italy 33 GW US India 46 GW 145 GW China 258 GW 137 GW Added in 2016 * Excluding Hydro Power
Capital Cost Comparison While capital costs for a number of Alternative Energy generation technologies are currently in excess of some conventional generation technologies, declining costs for many Alternative Energy generation technologies, coupled with uncertain long-term fuel costs for conventional generation technologies, are working to close formerly wide gaps in electricity costs.
Unsubsidized Levelized Cost of Energy Comparison Certain Alternative Energy generation technologies are cost-competitive with conventional generation technologies under some scenarios; such observation does not take into account potential social and environmental, reliability or intermittency-related considerations
Levelized Cost of Energy Comparison Sensitivity to Fuel Prices Variations in fuel prices can materially affect the levelized cost of energy for conventional generation technologies, but direct comparisons against competing Alternative Energy generation technologies must take into account issues such as dispatch characteristics (e.g., baseload and/or dispatchable intermediate load vs. peaking or intermittent technologies)
Levelized Cost of EnergySolar PV (Historical) Over Over the last the last eight years solar solar PV PV has become has become increasingly cost increasingly cost- - competitive with competitive with conventional generation conventional generation technologies, on an technologies, on an unsubsidized basis, in light unsubsidized basis, in light of material declines in the of material declines in the pricing of system pricing of system components (e.g., panels, components (e.g., panels, inverters, inverters, racking, racking, etc.), and dramatic improvements in dramatic improvements in efficiency, among other efficiency, among other factors factors eight years, , etc.), and
Global Trend in Renewable Energy Investment 2006 2006 2007 2007 2008 2008 2009 2009 2010 2010 2011 2011 2012 2012 2013 2013 2014 2014 2015 2015 2016 2016 Billion USD NEW INVESTMENT BY STAGE Technology Research Technology Research Government R&D Corporate R&D 2.2 2.9 2.7 3.2 2.8 3.6 5.4 3.8 4.9 3.9 4.8 4.5 4.7 4.2 5.2 4 4.5 3.9 4.4 4.2 5.5 2.5 Manufacturing Manufacturing Prevate equity Epansion Capital Public markets 3.1 9.3 3.5 21.4 6.9 10.8 3.1 12.7 5.5 10.8 2.4 9.9 1.7 4 1.4 10.3 1.8 15.9 1.9 13.3 2.2 6.3 Projects Projects Asset finance (re-invested equity) Small-scale distrebuted capacity 85.5 0.8 114.9 2.6 135.6 3.6 120.5 1.9 155.1 1.5 183.5 1.8 169.4 2.6 159.3 1 194.4 3.3 237.4 6.1 187.1 2.9 9.4 14 22.1 330 62.2 75.2 71.6 54.4 60 55.5 39.8 Total New Total New Investment Investment 112.7 112.7 159.3 159.3 181.4 181.4 178.3 178.3 243.6 243.6 281.2 281.2 255.5 255.5 234.4 234.4 278.2 278.2 312.2 312.2 241.6 241.6 Merger & Acquisition Merger & Acquisition Transactions Transactions 35.8 58.6 59.5 64.3 58.8 73 66.6 66.1 86.6 94.1 110.3 Total Transaction Total Transaction 148.5 148.5 217.9 217.9 240.9 240.9 242.5 242.5 302.4 302.4 354.2 354.2 322.1 322.1 300.5 300.5 364.8 364.8 406.3 406.3 351.9 351.9
351 bn$ Whoa! That s a big number,
Vision 2030 SAUDI ARABIA a market of renewable energy
Saudi Energy Facts Forecasted Peak Demand* (GW) 140 120 GW 120 100 75 GW 80 GW 43 GW 8.3 60 3.4 MBOE MBOE 40 20 2010 0 2028 2010 2020 Year 2032 *ECRA
Saudi Energy Facts 140 Uniform day-to-night variation year round 120 100 Seasonal change in peak load exceeds 40% Day Day 80 GW GW 60 Night Night 40 20 0 100 109 118 127 136 145 154 163 172 181 190 199 208 217 226 235 244 253 262 271 280 289 298 307 316 325 334 343 352 361 10 19 28 37 46 55 64 73 82 91 1
Saudi Energy Facts 90 450 80 400 70 350 60 300 Number of Critical Hours Number of Critical Days 50 250 40 200 30 150 5% of Installed Generation Capacity used for 48 hours/year 20 100 10 50 0 0 0% 1% 2% 3% 4% 5% 6% 7% 8% 9% 10% Number if Critical Days Number if Critical Hours
Renewable Targets Luch the King Salman Renewable Energy Intitive Offering Fund through partnership Forming a legal and requlatory framework Place your screenshot here 9.5 GW 3.5 GW 2020 6 GW 2023
GCC Sustainable Energy Plan Kuwait 2020: 5% RE of capacity 2030: 15% RE of capacity CSP 5.6GW, PV 4.6GW, Wind 0.7GW Bahrain 2020: 5% RE of capacity Qatar 2030: 20% RE of capacity (1800MW) UAE 2021: 24% clean energy 2020: (Abu Dhabi) 7% of capacity 2030: (Dubai) 5GW Solar PV Oman 2015: 5% in average gas cons. Per Kwh of generation Saudi Arabia 2020: 3.5 GW RE 2023: 9.5 GW RE
Saudi Sustainable Energy Plan ( (9.5 9.5 GW GW) ) CREATE RENEWABLE ENERGY INDUSTRY ENCOURAGE PUBLIC-Private partnerships Allow the private sector to buy & invest in RE Accounts Accounts for the Kingdom the Kingdom s total generation generation capacity by by 2023 2023 for 10 10% % of s total capacity of NATIONAL RENEWABLE ENERGY PROGRAM Responsible for all RE related initiatives in the Kingdom Review legal & regulatory frameworks INVESTING FOR THE LONG TERM Localization is key Localize R&D, manufacturing & other sections of the value chain Involve investment Involve investment $ $30 30 bn bn - - $ $50 50 bn bn
The Truth about Job Creation INVEST INVEST $ $ 1,000,000 1,000,000 IN THE FOLLOWING INDUSTRIES, YOU GET THESE MANY JOBS IN THE FOLLOWING INDUSTRIES, YOU GET THESE MANY JOBS 5 5 7 7 13 13 14 14 16 16
Solar PV Business Value Chain Building a World-Class Solar Energy Sector Industrial investment Research, development and innovation Technology development Education and training Human capacity development
Solar PV Business Value Chain Manufacturing PV Module, Inveter, Tracking System, Junction Box, and moutn Structure. Development To develop solar power plant in IPP, BOO or BOT shcem. Own, operate and maintain the plant to sell the electricity to the off- takers. EPC To perform the engineering, procurment and construction for solar power plant. Finanical Services Financial resources lender such as banks or IFC. Training To build human capacity through offcial training academcy. O&M Solar plants operation and maintnance. R&D Research and development. I&C To handle information and communication technologies aspects. Testing Testing and standardization for solar plant components.
THE FUTURE OF ENERGY AND THE FUTURE OF ENERGY AND WATER Includes being, fully powered by renewable energy, forward looking energy storage and transport solutions as well as R&D and manufacturing. In addition, utilizing green technology in building water capabilities and maximizing usage efficiency WATER RICHNESS IN NATURAL RESOURCES Perennial solar resources (20 MJ/m ) The area is also rich in Oil and Gas as well as mineral resources. Ideal wind speed (an average of 10.3 m/s) NEOM provides an ideal environment in which to develop renewable energy projects
The Stone Age did not end for lack of stone, and the Oil Age will end long before the world runs out of oil Ahmed Zaki Yamani, Former Minister of Oil Petroleum and Mineral Resources
A snapshot of Need
Thanks! ANY QUESTIONS? You can find me at: wbamhair@taqni.com Linkedin: Wail Bamhair


")


")