Essential Steps for Setting up a Modeling Study
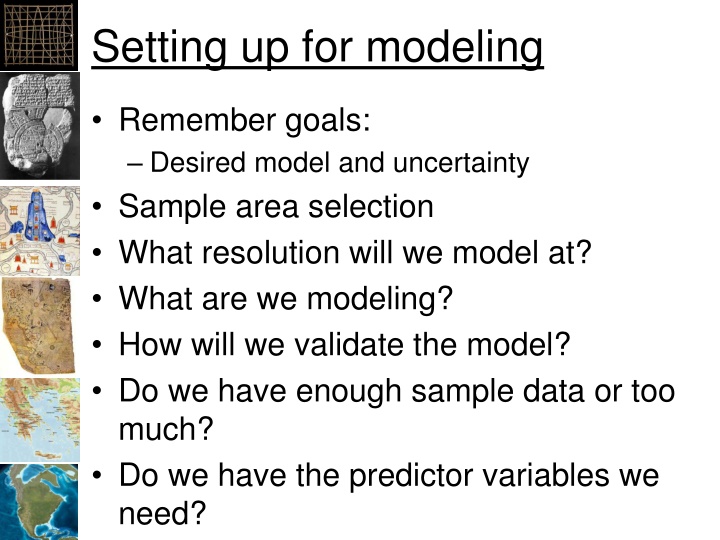
Ensure clarity on modeling goals and uncertainties. Select sample areas strategically based on interest and available data. Determine appropriate resolution for modeling. Define variables to model and validate the model effectively. Assess sample data adequacy and predictor variables availability. Explore the modeling process step by step for accurate results.

Download Presentation

Please find below an Image/Link to download the presentation.
The content on the website is provided AS IS for your information and personal use only. It may not be sold, licensed, or shared on other websites without obtaining consent from the author.If you encounter any issues during the download, it is possible that the publisher has removed the file from their server.
You are allowed to download the files provided on this website for personal or commercial use, subject to the condition that they are used lawfully. All files are the property of their respective owners.
The content on the website is provided AS IS for your information and personal use only. It may not be sold, licensed, or shared on other websites without obtaining consent from the author.
E N D
Presentation Transcript
Setting up for modeling Remember goals: Desired model and uncertainty Sample area selection What resolution will we model at? What are we modeling? How will we validate the model? Do we have enough sample data or too much? Do we have the predictor variables we need? namNm15
Sample Area Selection What is the area of interest? How was the area sampled? Optimal: rigorously sampled, randomly spaced plots Worse case: data integrated from multiple sources with little documentation on collection methods How far can we extend the study area realistically? Best to pad the extent a bit namNm15
Sample Area Selection CA Douglas fir namNm15
Sample Area Selection CA Redwood (coastal) namNm15
Sample Area Selection CA - Giant Sequoia namNm15
Resolution Higher resolution: Better detail Can be misleading Performance problems Lower resolution: Much faster processing Can hide niche environments Recommendation: Use lowest predictor layer resolution for all layers, or lower Grid to lower resolution as needed namNm15
What are we modeling? Need a relationship we can model Measured variables: Height, DBH, Canopy size Weight, length, grain size, proportion Income, longevity Presence/Absence: Logistic regression Occurrences: Point Density? namNm15
Sample Data Too many points will overwhelm R Sub-sample Aggregate Too few points will not represent the phenomenon Get more data? Switch to a simulation Give up? namNm15
Predictors Look far and wide Transform predictors as needed Investigate what will predict the phenomenon Visit the site, talk to experts Switch to a simulation? Give up? namNm15