Understanding Physical Flow Accounts and Environmental-Economic Framework
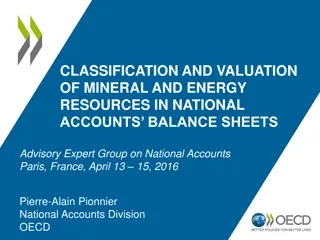
Explore the significance of physical flow accounts, the economy, and the environment within the framework of the System of National Accounts (SNA) and the System of Environmental-Economic Accounts (SEEA). Learn about material consumption, energy use analysis, environmental assessment, and more. Gain insights into how industries, assets, sectors, and natural resources interact in the economic landscape.
- Physical Flow Accounts
- Environmental-Economic Framework
- System of National Accounts
- System of Environmental-Economic Accounts
- Statistics
Download Presentation

Please find below an Image/Link to download the presentation.
The content on the website is provided AS IS for your information and personal use only. It may not be sold, licensed, or shared on other websites without obtaining consent from the author. Download presentation by click this link. If you encounter any issues during the download, it is possible that the publisher has removed the file from their server.
E N D
Presentation Transcript
Physical Flow Accounts: Overview UNSD SEEA Training of Trainers Seminar 7-10 July 2015, Santiago Joe St. Lawrence Statistics Canada
The Economy The Economy and The Environment and The Environment -Natural Resources -Ecosystem Services Stocks The Economy Flows -Residuals Expenditures 2024-10-01 Statistics Canada Statistique Canada 2
Uses of physical flow accounts Uses of physical flow accounts Material consumption Material productivity Energy use analysis Energy policy Emissions analysis Environmental assessment Natural resource management Multi-factor productivity Footprint calculations 2024-10-01 Statistics Canada Statistique Canada 3
System of National Accounts System of National Accounts framework framework Industries Final demand Assets Sectors Financial and produced assets, opening balance Industrial output of goods and services Industrial intermediate demand Gross fixed capital formation Final demand Commodities Wastes Other changes in volume & holding gains/losses on financial & produced assets Sectors Financial and produced assets, closing balance 2024-10-01 Statistics Canada Statistique Canada 4
System of Environmental System of Environmental- -Economic Accounts (SEEA) framework Accounts (SEEA) framework Economic Industries Final demand Assets Sectors Financial and produced assets, opening balance Natural resource assets, opening balance Natural resource assets, opening balance Industrial output of goods and services Industrial intermediate demand Gross fixed capital formation Final demand Commodities Environmental protection expenditures Environmental protection expenditures Capital expenditures for environmental protection Resource production by industries Resource production by households/gov t Resource use by industries Resource use by households/gov t Waste consumption by industries Waste consumption by households/gov t Wastes Waste output by industries Waste output by households/gov t Other changes in volume & holding gains/losses on financial & produced assets Changes in and holding gains/losses on natural resource assets Changes in natural resource assets Sectors Financial and produced assets, closing balance Natural resource assets, closing balance Natural resource assets, closing balance 2024-10-01 Statistics Canada Statistique Canada 5
Physical Flow Accounting Physical Flow Accounting Industries Final demand Assets Sectors Financial and produced assets, opening balance Natural resource assets, opening balance Natural resource assets, opening balance Industrial output of goods and services Industrial intermediate demand Gross fixed capital formation Final demand Commodities Environmental protection expenditures Environmental protection expenditures Capital expenditures for environmental protection Resource production by industries Resource production by households/gov t Resource use by industries Resource use by households/gov t Waste consumption by industries Waste consumption by households/gov t Wastes Waste output by industries Waste output by households/gov t Other changes in volume & holding gains/losses on financial & produced assets Changes in and holding gains/losses on natural resource assets Changes in natural resource assets Sectors Financial and produced assets, closing balance Natural resource assets, closing balance Natural resource assets, closing balance 2024-10-01 Statistics Canada Statistique Canada 6
Physical Flow Accounts: Basic Tables 2024-10-01 Statistics Canada Statistique Canada 7
Physical Flow Accounts: Natural Inputs 3.45 Natural inputs are all physical inputs that are moved from their location in the environment as a part of economic production processes or are directly used in production. 2024-10-01 Statistics Canada Statistique Canada 10
Physical Flow Accounts: Products 3.64 Following the SNA, products are goods and services that result from a process of production in the economy. North American Product Classification System (NAPCS) Canada 2012 Version 1.1 Classification structure 111 Live animals 112 Wheat 113 Canola (including rapeseed) 114 Fresh fruit, nuts and vegetables 115 Other crop products 116 Other animal products 121 Fish, shellfish and other fishery products 131 Logs, pulpwood and other forestry products 141 Crude oil and crude bitumen 142 Natural gas 143 Natural gas liquids and related products 144 Other energy products 145 Electricity 146 Natural gas distribution 151 Iron ores and concentrates etc 2024-10-01 Statistics Canada Statistique Canada 11
Physical Flow Accounts: Residuals 3.73 Residuals are flows of solid, liquid and gaseous materials, and energy that are discarded, discharged or emitted by establishments and households through processes of production, consumption or accumulation. 2024-10-01 Statistics Canada Statistique Canada 12
Compilation Data sources: Survey data Administrative data Existing statistics Issues: Correcting for residence principle Disaggregating information to ISIC Consistency with National Account concepts Compiling time series 2024-10-01 Statistics Canada Statistique Canada 13
Compilation Exercise Complete a water flow diagram based on the data provided. 2024-10-01 Statistics Canada Statistique Canada 14
Compilation Exercise Complete a water flow diagram based on the data provided. 2024-10-01 Statistics Canada Statistique Canada 15
Compilation of supply and use tables Mining of oil resources by mining industry (100 mln kg) Supply of crude oil to refinery (100 mln kg) Refining of crude oil production of petrol (80 mln kg) Export of petrol (50 mln kg) Use of petrol by Households (30 mln kg) With thanks to Statistics Netherlands! 2024-10-01 Statistics Canada Statistique Canada 16
Mining of oil resources by mining industry (100 mln kg) Supply Mining (ISIC 6) Refinery (ISIC 19)Households Import Environment TOTAL Oil resources 100 100 Natural inputs O2 0 Crude oil 0 Products Petrol 0 0 Residuals CO2 100 0 0 0 0 100 TOTAL Use Mining (ISIC 6) Refinery (ISIC 19)Households Export Environment TOTAL Oil resources 100 100 Natural inputs O2 0 Crude oil 0 Products Petrol 0 0 Residuals CO2 100 100 0 0 0 0 TOTAL 2024-10-01 Statistics Canada Statistique Canada 17
Supply of crude oil to refinery (100 mln kg) Supply Mining (ISIC 6) Refinery (ISIC 19)Households Import Environment TOTAL Oil resources 100 100 Natural inputs O2 0 Crude oil 100 100 Products Petrol 0 0 Residuals CO2 200 100 0 0 0 100 TOTAL Use Mining (ISIC 6) Refinery (ISIC 19)Households Export Environment TOTAL Oil resources 100 100 Natural inputs O2 0 Crude oil 100 100 Products Petrol 0 0 Residuals CO2 200 100 100 0 0 0 TOTAL 2024-10-01 Statistics Canada Statistique Canada 18
Refining of crude oil petrol (80 mln kg) & Export of petrol (50 mln kg) Supply Mining (ISIC 6) Refinery (ISIC 19)Households Import Environment TOTAL Oil resources 100 100 Natural inputs O2 0 Crude oil 100 100 Products Petrol 80 80 0 Residuals CO2 280 100 80 0 0 100 TOTAL Use Mining (ISIC 6) Refinery (ISIC 19)Households Export Environment TOTAL Oil resources 100 100 Natural inputs O2 0 Crude oil 100 100 Products Petrol 30 50 80 0 Residuals CO2 280 100 100 30 50 0 TOTAL 2024-10-01 Statistics Canada Statistique Canada 19
CO2 emissions by refineries Supply Mining (ISIC 6) Refinery (ISIC 19)Households Import Environment TOTAL Oil resources 100 100 Natural inputs O2 60 60 Crude oil 100 100 Products Petrol 80 80 80 80 Residuals CO2 420 100 160 0 0 160 TOTAL Use Mining (ISIC 6) Refinery (ISIC 19)Households Export Environment TOTAL Oil resources 100 100 Natural inputs O2 60 60 Crude oil 100 100 Products Petrol 30 50 80 80 80 Residuals CO2 420 100 160 30 50 80 TOTAL 2024-10-01 Statistics Canada Statistique Canada 20
CO2 emissions by households Supply Mining (ISIC 6) Refinery (ISIC 19)Households Import Environment TOTAL Oil resources 100 100 Natural inputs O2 150 150 Crude oil 100 100 Products Petrol 80 80 80 120 200 Residuals CO2 630 100 160 120 0 250 TOTAL Use Mining (ISIC 6) Refinery (ISIC 19)Households Export Environment TOTAL Oil resources 100 100 Natural inputs O2 60 90 150 Crude oil 100 100 Products Petrol 30 50 80 200 200 Residuals CO2 630 100 160 120 50 200 TOTAL 2024-10-01 Statistics Canada Statistique Canada 21
Check the accounting identities! Supply Mining (ISIC 6) Refinery (ISIC 19)Households Import Environment TOTAL Oil resources 100 100 Natural inputs O2 150 150 Crude oil 100 100 Products Petrol 80 80 80 120 200 Residuals CO2 630 100 160 120 0 250 TOTAL Use Mining (ISIC 6) Refinery (ISIC 19)Households Export Environment TOTAL Oil resources 100 100 Natural inputs O2 60 90 150 Crude oil 100 100 Products Petrol 30 50 80 200 200 Residuals CO2 630 100 160 120 50 200 TOTAL 2024-10-01 Statistics Canada Statistique Canada 22
Compilation Exercise continued... Use the water flow diagram to compile a supply and use table for water. 2024-10-01 Statistics Canada Statistique Canada 23
Compilation Exercise solution... Industry (ISIC 05- 99 less 3510, 36, and 37) Hydro- electricity (ISIC 3510) Thermal Electricity (ISIC 3510) Water Supply: drinking water (ISIC 36-A) Water Supply: irrication (ISIC 36-B) SUPPLY Agriculture (ISIC 01-03) Sewerage (ISIC 37) Households Environment Total Surface water 22,451 22,451 Ground water 438 438 Sea water 39 39 Water, drinking (CPC 18-A) 469 469 Water, irrigation (CPC 18-B) 1,120 1,120 Reuse water 40 40 Losses 50 190 316 556 Wastewater Evaporation, transpiration, included in products 644 141 19,600 618 287 280 21,570 966 61 32 70 1,129 Total 1,660 202 19,600 650 659 1,436 327 350 22,928 47,812 2024-10-01 Statistics Canada Statistique Canada 24
Compilation Exercise solution... Industry (ISIC 05- 99 less 3510, 36, and 37) Hydro- electricity (ISIC 3510) Thermal Electricity (ISIC 3510) Water Supply: drinking water (ISIC 36-A) Water Supply: irrication (ISIC 36-B) USE Agriculture (ISIC 01-03) Sewerage (ISIC 37) Households Environment Total Surface water 345 19,600 650 420 1,436 22,451 Ground water 155 83 200 438 Sea water 39 39 Water, drinking (CPC 18-A) 119 350 469 Water, irrigation (CPC 18-B) 1,120 1,120 Reuse water 40 40 Losses 556 556 Wastewater Evaporation, transpiration, included in products 327 21,243 21,570 1,129 1,129 Total 1,660 202 19,600 650 659 1,436 327 350 22,928 47,812 2024-10-01 Statistics Canada Statistique Canada 25
Questions? Questions? Joe St. Lawrence Joe St. Lawrence Statistics Canada | 170 Tunney's Pasture Driveway, Ottawa ON K1A 0T6 Statistics Canada | 170 Tunney's Pasture Driveway, Ottawa ON K1A 0T6 Statistique Statistique Canada | 170, promenade Tunney's Pasture, Ottawa ON K1A 0T6 Canada | 170, promenade Tunney's Pasture, Ottawa ON K1A 0T6 Joe.St.Lawrence@statcan.gc.ca Joe.St.Lawrence@statcan.gc.ca Telephone | Telephone | T l phone T l phone 613 613- -882 882- -8598 8598 Facsimile | Facsimile | T l copieur T l copieur 613 613- -951 951- -0634 0634 Government of Canada | Government of Canada | Gouvernement Gouvernement du Canada du Canada 2024-10-01 26
