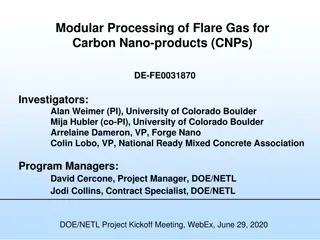
Gas Cool-Down Method and Test Mass Curves Study
Diagrams and data charts illustrate the N2 gas cool-down method and test mass curves study conducted by Jaimi Salone and Edgard Bonilla on 08/28/18. The study focuses on maintaining pressure internally, cooling down the test mass efficiently, and achieving successful outcomes in pressure control across different components of the system.

Download Presentation

Please find below an Image/Link to download the presentation.
The content on the website is provided AS IS for your information and personal use only. It may not be sold, licensed, or shared on other websites without obtaining consent from the author. Download presentation by click this link. If you encounter any issues during the download, it is possible that the publisher has removed the file from their server.
E N D
Presentation Transcript
N2 Gas Cool-Down Method Jaimi Salone & Edgard Bonilla 08/28/18
Final Configuration: 8/28/18 2
PF1: Pressure Gauge inside inner shield PF2: Pressure Gauge on Reservoir PF3: Pressure Gauge on ADP 81 PF4: Pressure Gauge on Small Turbo (Interior) PF5: Pressure Gauge in Main Chamber Target Pressures Cryo-System Diagram Sensor Readout/Control LN2 Outlet Outer Shield Sensor Readout/Control 1.5*10-4 Torr 3*10-2 Torr PF5 Blue Dewar (LN2) Temp Sensor Optic small turbo pump PF1 10-3 Torr V15 system: shut-off V14 system: calibrated leak PF4 Inner Shield Pump valve Heat Gun vent PF2 fill Heating Tray vent PF3 Scroll Pump Vacuum Chamber 10 Torr ADP 81 Reservoir 3 J. Salone 08/23/18
LN2 inlet Thermal links Shield Diagram (View from top with inner shield closed) Outer shield 8.5 Inner shield 1.5 8.5 11 3 3.75 2.625 Outlet to small turbo pump 1.25 Inlet on outer shield 1.625 11 *Electric feedthrough not included in diagram Inlet on inner shield 4 J. Salone 08/28/18
Shield Diagram 11 Copper nitrogen piping LN2 inlets for shields Gaseous nitrogen inlet 11 3 Small Turbo Pump outlet Left side 14.25 *Electric feed-through not included in diagram. 3.75 2 4.25 8 3 6.5 3.625 5 J. Salone 08/28/18
Goals for gas run: Maintain Pressure internally: still need to retrieve data 1.5 E-4 Torr in Chamber Appears to maintain in 1.5 E-4 Torr range +/- 5E-5 , and lower, virtually the whole test. 10 Torr for the Reservoir The component with the most human interaction. We tried to keep it between 13 and 8 Torr the whole time. Less important so long as Inner Shield pressure is constant. 3 E-2 Torr in the Inner Shield Adjusted Reservoir specifically to maintain this pressure, appeared +/- 1.5E-2. 1 E-3 Torr for the Small Turbo Great success, stayed in the E-4 range the whole time. Didn t bust the Small Turbo! Cool down the test mass faster: clear results 8/28/18 6
Radiative Cool-Down: 8/28/18 7
N2 Gas Cool-Down: 8/28/18 8
Test Mass Curves: 8/28/18 9