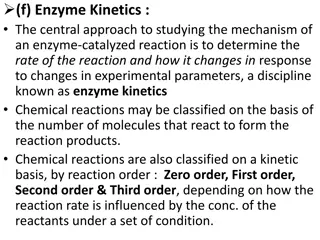
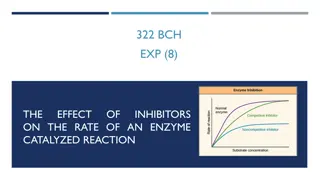
Factors Affecting Enzyme Activity and Catalysis

Enzyme activity is influenced by various factors such as enzyme concentration, temperature, pH, substrate concentration, inhibitors, activators, and physical agents. The rate of enzyme-catalyzed reactions is directly proportional to enzyme concentration, and temperature plays a significant role with an optimum range for most enzymes. pH affects enzyme activity due to changes in the charged state of catalytic sites and enzyme conformation. Additionally, activators like inorganic metallic cations/anions can enhance enzyme function, while inhibitors can block substrate binding or alter enzyme structure.

Download Presentation

Please find below an Image/Link to download the presentation.
The content on the website is provided AS IS for your information and personal use only. It may not be sold, licensed, or shared on other websites without obtaining consent from the author. Download presentation by click this link. If you encounter any issues during the download, it is possible that the publisher has removed the file from their server.
E N D
Presentation Transcript
1. Enzyme concentration 2. Temperature 3. Hydrogen ion concentration or pH 4. Substrate concentration 5. Inhibitors 6. Product concentration 7. Activators 8. Physical agents
The rate of enzyme catalyzed reaction is directly proportional to the concentration of enzyme. The plot of rate of catalysis versus enzyme concentrations a straight line
Increase with temperature Bell shape curve Q10 (temperature coefficient)- factor by which the rate of biological reaction increases for a 10 C increase in temperature Optimum temperature Mostly at body temperature Some enzyme may be active above body temperature e.g. sanke venom phosphokinase, muscle adenylate kinase, urease, enzymes in thermophillic bacteria
Rise or fall in enzyme activity with temperature is prominent survival feature in Cold blooded animals In mammals- assumes physiological importance e.g. fever, hypothermia
Bell shape curve Optimum pH Most show at neutral pH (6-8) Since enzymes are proteins pH changes affect. 1. Charged state of catalytic site 2. Conformation of enzyme molecules
Trypsin- 7.6 Pepsin- 2-2.5 Acid phosphatase- 5 Alkaline phosphatase- 9-10 Enzymes from fungi- 4-6
Accumulation - decreases the velocity In biological system this is prevented by quick removal of product
Inorganic metallic cation/anions acts as activators by combining with substrate, ES complex, change in conformation of active site Metal activated enzymes- e.g. ATPase, Enolase Metalloenzyme- e.g.Pyruvate oxidase, cytochrome oxidase
Make active site unavailable to substrate or Change enzyme structrure
Light, radiation ( u.v., X- rays, gamma rays etc) e.g. salivary amylase- activity increased by red/ blue light whereas decreased by u.v. light
Rectangular hyperbola (Michaelis plot) Initial velocity- velocity when little substrate is reacted
Reasons for the three phases of the curve can be interpreted 1. In the first phase, substrate concentration is low and most of the enzyme molecules are free so they combine with the substrate molecules. Therefore, velocity is proportional to substrate concentration. At this state, enzymatic reaction shows first 2. In the second phase, half of the enzyme molecules are bound to substrate, so the velocity is not proportional to substrate concentration. At this stage, enzymatic reaction shows mixed kinetics 3. In the third phase, all the enzyme molecules are bound to substrate, so velocity remain unchanged because free enzyme is not available though the substrate is in excess. At this stage enzymatic reaction shows zero first- -order kinetics order kinetics mixed- -order order kinetics zero- -order kinetics order kinetics
The M-M equation was derived in part by making several assumptions. An important one was: the concentration than I In the situation where [S] >> [E] and at initial velocity rates, it is assumed that the changes in the concentration of the intermediate ES complex are very small over time (vo). This condition is termed a steady is referred to as steady it it follows equal the concentration of than the of substrate enzyme concentration substrate must concentration. . must be be much much greater greater the enzyme steady- -state state kinetics rate of ES breakdown state rate, Therefore, ES formation breakdown. . rate, and steady- -state that the to the kinetics. . Therefore, of ES follows that equal to the rate rate ES formation will will be be the rate
3 2 4 Rate of ES formation = k1([ET] - [ES])[S] (where [ET] is total concentration of enzyme E and k4 is considered neglible) Rate of ES breakdown to product = k 2[ES] + k3[ES]
Thus for the steady state assumption: k1([ET] - [ES])[S] = k3[ES] + k2[ES] This equation is the basis for the final Michaelis- Menten following algebraic rearrangement and substitution of Km and Vmax terms
S + v S = max v K M In which: v KM the Michaelis constant vmax the maximum possible initial reaction velocity initial reaction velocity at [S]
The substrate concentration that produces half the maximal velocity (Vmax/2) is known as Michaelis constant Michaelis constant (Km )
Michaelis constants have been determined for many of the commonly used enzymes. The size of Km tells us several things about a particular enzyme: 1. A small Km indicates that the enzyme requires only a small amount of substrate to become saturated. Hence, the maximum velocity is reached at relatively low substrate concentrations. 2. A large Km indicates the need for high substrate concentrations to achieve maximum reaction velocity. The substrate with the lowest Km upon which the enzyme acts as a catalyst is frequently assumed to be enzyme's natural substrate, though this is not true for all enzymes. A Kmof 10-7M indicates that the substrate has a greater affinity for the enzyme than if the Kmis 10-5M.
1. 2. Indicates the substrate concentration required for the enzyme to work efficiently 3. Low Km indicates high affinity of enzyme towards substrate. And vice-versa. Hence,(Km 1/affinity) e.g. Km of hexokinase is low (1 10 5 M) whereas Km of glucokinase is high (2.0 10 2 M) 4. Km is required when enzymes are used as drugs 5. Use of enzymes in immunodiagnostics (ELISA) require Km of the enzyme enzyme kinetic constant. e.g. Hexokinase and glucokinase
At high substrate concentration the overall velocity of the reaction is Vmaxand the rate is determined by the enzyme concentration. The rate constant observed under these conditions is called the catalytic constant, kcat,defined as: kcatindicates the maximum number of substrate molecules converted to product each second by each active site. This is called turnover number. The catalytic constant measures how fast a given enzyme can catalyze a specific reaction (describing the effectiveness of an enzyme) The unit for kcatis s-1(for the most enzymes, kcatis 102to 103 s-1)
Lineweaver-BurK Plot V = reaction velocity (the reaction rate), Km = Michaelis-Menten constant, Vmax = maximum reaction velocity [S] = the substrate concentration


")