Understanding Enzyme Activity and Optimal Conditions

This interactive content provides a detailed exploration of enzyme activity through data interpretation and graph analysis. Questions range from identifying the impact of enzymes on specific molecules to determining optimal conditions for various enzyme functions such as pH and temperature. Users delve into concepts like substrate concentration, enzyme denaturation, and the relationship between graph trends and enzyme effectiveness. The content covers a range of scenarios, from comparing enzyme reactions to understanding optimal pH for different enzymes. Enzyme activity variables, optimal conditions, and practical applications in both humans and thermophilic bacteria are also discussed.

Download Presentation

Please find below an Image/Link to download the presentation.
The content on the website is provided AS IS for your information and personal use only. It may not be sold, licensed, or shared on other websites without obtaining consent from the author. Download presentation by click this link. If you encounter any issues during the download, it is possible that the publisher has removed the file from their server.
E N D
Presentation Transcript
Enzyme Station Activity INTERPRETING DATA & GRAPHS
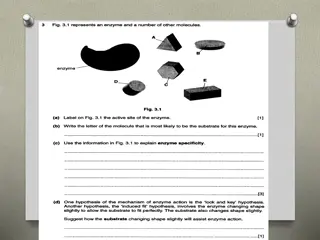
Station Station 1 1 1. The enzyme would most likely affect reactions involving A. molecule A, only B. molecule C, only C. molecules B and D D. molecules A and C 2. Which graph, A or B, shows the amount of substrate going to zero faster? 3. If both graphs A and B show the rate of an enzyme, which enzyme is more effective? (hint: think about which makes the product fastest)
Station 2 Station 2 4. What variables affect enzyme activity in each of the graphs? A. _______________________________ B. _______________________________ C. _______________________________ 5. What is the optimal condition for each enzyme represented by the graphs? The optimal condition is when the enzyme would work best. A. _______________________________ B. _______________________________
Station Station 2 2 6. What happens when an enzyme gets too hot? 7. Explain why graph C levels off. Use enzyme and substrate in your explanation. Why doesn t it matter if enzymes keep getting added?
Station Station 3 3 8. What is the optimal pH for both enzymes? A. Pepsin _____________ B. Trypsin_____________ 9. Predict the reactivity of trypsin at pH 14 A. B. C. It s working optimally (best) The enzyme will be denatured(change shape) and not work The enzyme will work at a medium rate 10. At what pH do neither enzyme work? 11. Which enzyme works best at pH 3? 12. At what pH values is pepsin likely to be denatured?
Station Station 4 4 Use the graph below to answer questions 13-15. 13. At what temperature does this enzyme work optimally (best)? 14. What happens to the enzyme activity as the temperature decreases from 20 C to 10 C? 15. How can the enzyme activity be slowed down? A. Increase temperature from 10 C to 20 C B. Increase temperature from 20 C to 30 C C. Decrease the temperature from 30 C to 20 C
Station 5 Station 5 16. Humans share several enzymes with thermophilic bacteria. A. What is the temperature that enzymes work optimally in humans?_______ B. What is the temperature that enzymes work optimally in thermophiles?_______ 17. At what temperature will the enzyme function for both human and thermophiles? A. 10 C B. 40 C C. 50 C
Station Station 6 6 Based on the graph above: 18. Which enzyme works best in neutral conditions? 19. Which enzyme is not affected by pH? 20. Which enzyme works under basic conditions? 21. Which enzyme might be found in acidic stomach acid?
Station Station 7 7 The following graph shows data recorded on the effect of temperature on the functioning of salivary amylase. 21. What is an appropriate title for this graph? 22. What is the independent variable? 23. What is the dependent variable? 24. Based on these results, at what temperature does amylase react the fastest? 25. What do you think would happen if the temperature were raised above boiling (100 C)?
Station Station 8 8 The following graph shows data recorded on the effect of pH on the functioning of salivary amylase. 26. Based on these results, what is the optimal (best) pH for amylase? 27. Is this optimal pH considered acidic, basic, or neutral? 28. Why does the activity decrease when the pH is too low or too high?
Station 9 Station 9 29. The substrate for a particular reaction is shown below. In the box labeled Enzyme, predict the shape of the enzyme that will react with this substrate. Draw the enzyme that would work with that substrate. 30. Explain the significance of the shape of the enzyme that you just drew. 31. In the box below, predict the shape of the enzyme AFTER the reaction has taken place.. Draw it and explain your prediction. 32. In the box below, predict the shape of the enzyme AFTER the reaction has taken place. Draw it and explain your prediction.
Station Station 10 10 Application: 33. During an illness, like the flu, one may experience very high fevers. How might this affect the functioning of enzymes in the body and the length or time required for recovery? 34. The fur color of the adult northern seal, created by a dark brown pigment, is due to a specific enzyme. Suggest reasons why baby seals are born with a pure white coat.
Station Station 11 Honors Honors 11 Answer the questions based on the graphs.
Station Station 11 11 Honors Honors Answer the questions based on the graphs in Part I. 35. What is the function of an enzyme? 36. What is happening to the substrate with enzyme function? 37. Describe the pattern of enzyme function shown by the data in the graphs. 38. At which pH is the enzyme functioning best? Explain why. 39. If at one pH the substrate is all converted to product in 5 seconds, and at another pH it takes 7 seconds for all of the substrate to be converted, at which pH is the enzyme functioning best? Why?
Station 12 Station 12 Honors Honors Answer the following questions based on the graphs. 40. Describe the pattern of enzyme function shown by the data in the graphs. 41. At which temperature is the enzyme functioning best? Explain why.
Extra Question Looking at graph B, as the enzyme concentration increases, the rate of reaction ___________. Increases, decreases, stays the same)