Evaluation Methods for Liver Steatosis in Obese Children
This study examines the assessment of liver steatosis in obese children using MRI, ultrasound, and biology techniques, evaluating methods such as attenuation coefficient and proton density fat fraction. The aim is to develop noninvasive biomarkers and validate existing scores for predicting NAFLD. Patients aged 0–18 with BMI >30 were included, with exclusions based on contraindications to MRI and syndromic disorders. The study reveals insights into the prevalence and evaluation of liver steatosis in this population.

Download Presentation

Please find below an Image/Link to download the presentation.
The content on the website is provided AS IS for your information and personal use only. It may not be sold, licensed, or shared on other websites without obtaining consent from the author. Download presentation by click this link. If you encounter any issues during the download, it is possible that the publisher has removed the file from their server.
E N D
Presentation Transcript
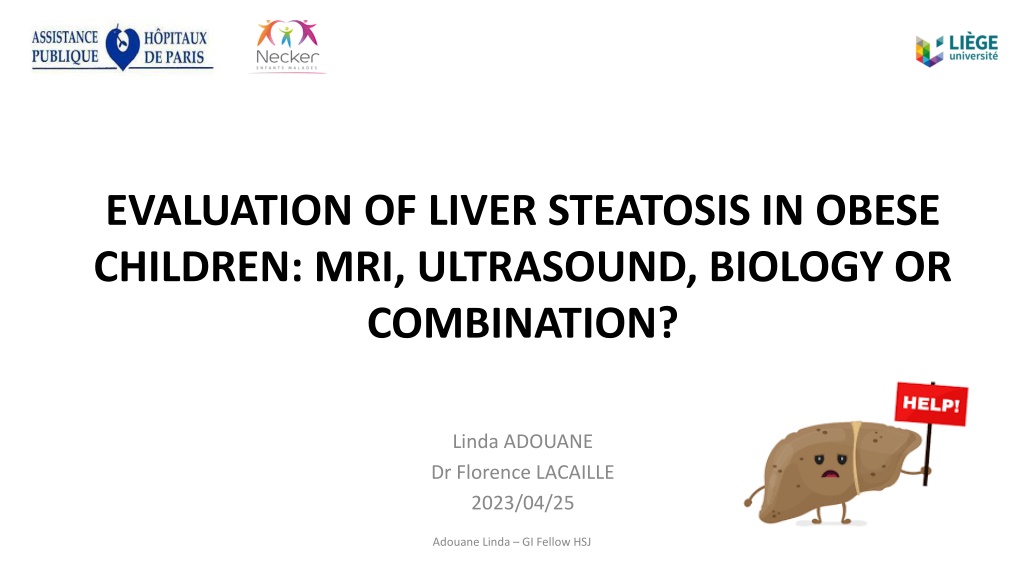
EVALUATION OF LIVER STEATOSIS IN OBESE CHILDREN: MRI, ULTRASOUND, BIOLOGY OR COMBINATION? Linda ADOUANE Dr Florence LACAILLE 2023/04/25 Adouane Linda GI Fellow HSJ
AUTHORS STATEMENTS No funding. No conflicts of interest.
BACKGROUND First-line method BUT never been validated or standardized Validated and standardized technique Gold standard
B. G. P. Koot and V. Nobili Screening for non-alcoholic fatty liver disease in children: do guidelines provide enough guidance? . Obesity Reviews, 2017
AIM Primary endpoint VERSUS Secondary endpoints - Developing NAFLD noninvasive biomarker correlated to PDFF. - Validation of NAFLD existing scores. - Establishing a new score that could be used to predict NAFLD.
PATIENTS AND METHOD Inclusion criteria - Age: 0 - 18 years - Body mass index (BMI) > IOTF 30 Exclusion criteria - Contraindications to MRI - Syndromic disorders, liver disease other than NAFLD, metabolic disease - Full set of tests not entirely conducted
Appraisal of steatosis Attenuation coefficient (ATT): 0.55 dB/cm/MHz. Speed of sound (SOS): 1.528 mm/ sec in fatty liver. Proton density fat fraction (PDFF): > 5%.
Study design All exams performed the same day Fast 6 hours Blood sample * *(ALOKA ARIETTA 850; Hitachi Ltd, Tokyo, Japan)
RESULTS Patients with BMI > IOTF 30 (n=118) Excluded (n=19) Patients with syndromic disorders Failure of MRI Failure to undergo all tests Eligible patients (n=99) evaluated as follows Laboratory data Liver steatosis (ATT, SOS, PDFF) Liver elastography (MRE, SWE) PDFF < 5% (n=55) PDFF > 5 % (n=44)
66% 44% 77%
Performance of US VS MRI ATT SOS => No correlation between US VS MRI.
Performance of biological parameters Parameter AUC Lower Upper ALT 0.88 0.81 0.95 AST 0.8 0.71 0.89 GGT 0.66 0.55 0.77 TG 0.72 0.61 0.82 HDL 0.63 0.52 0.74 HOMA 0.67 0.56 0.77 AST: Aspartate-aminotransferase; ALT: Alanine-aminotransferase; GGT: Gamma-glutamyl transferase; TG: Triglyceride; HDL-C: High density lipoprotein Cholesterol; HOMA: Homeostasis model of assessment of insulin resistance. => ALT is the best plasmatic biomarker to predict NAFLD, followed by AST and TG.
Validation of previous published scores AST/ALT Ratio (AAR) Reverse correlation: Lower values predict steatosis AAR: AST (U/l)/ALT (U/l)
Validation of previous published scores Triglyceride-Glucose Index (TyG) TyG: Log [(fasting triglycerides (mg/dL) x fasting glucose (mg/dL)/2]
Validation of previous published scores Hepatic Steatosis Index (HSI) HSI: 8 *ALT/AST + BMI (+2, if type 2 diabetes; +2, if female)
Conception of the ATE index ATE index = [ALT (U/l) + TG (mmol/l) + E (kPa)] AUC 0.89 {0.81-0.96}
p < 0.0001 33.6 => ATE index is a good predictive score of steatosis with a cutoff of 33.6.
DISCUSSION - Bias of selection - Missing data - Only one ultrasound system used - Lack of histology - No underlying liver disease - Reference center for obesity - Objective, diagnostic parameters - First known French study on the subject - Biomarker proposed: ATE index
TAKE-HOME MESSAGE Obesity = risk factor for NAFLD (44% in our cohort) MRI = validated, standardized noninvasive tool Ultrasound = not reliable (ALOKA ARIETTA 850; Hitachi Ltd, Tokyo, Japan) Biological + imaging = Always External validation of steatosis scores needed, including ATE index
Linda ADOUANE 1,2, Claire MAYER 1, Yanyan LIN 3,4, Anne-Marie TISSIER 5, Jean-Michel CORREAS 5, Ivan LERN 6, Myriam DABBAS 1,7, Florence LACAILLE 1. 1. Service de Gastroent rologie, H patologie et Nutrition p diatrique, H pital Universitaire Necker Enfant Malade, AP-HP et Centre National de Reference des Maladies rares, Paris, France 2. Universit de Li ge, Belgium 3. Department of Ultrasound, RuiJin Hospital, Shangai Jiaotong University, Shangai, China 4. Sorbonne Universit , CNRS, INSERM, Laboratoire d Imagerie Biom dicale, Paris, France 5. Service d Imagerie m dicale, H pital Universitaire Necker Enfant Malade, AP-HP, Paris, France 6. Informatique biom dicale, H pital Universitaire Necker Enfant Malade, AP-HP, Paris, France 7. Unit de Nutrition-Ob sit , H pital Necker Enfant Malade, AP-HP et Centre de r f rence m dico-chirurgical pour la prise en charge de l ob sit de l enfant et l adolescent, Paris, France.
Healthy liver * (n = 55) Fatty liver ** (n = 44) Characteristics Total (n = 99) Clinical Age at diagnosis (years) (median [IQR]) BMI (median [IQR]) 11 [10-13] 35.7 [32-40] 11 [8.5-12.5] 35.3 [32-38] 11 [9-13] 36 [33-41] Plasma biomarkers AST (U/l) (median [IQR]) ALT (U/L) (median [IQR]) GGT (U/l) (median [IQR]) HOMA (median [IQR]) TG (mmol/l) (median [IQR]) HDL-C (mmol/l) (median [IQR]) 27 [23-35] 24 [17-38] 19 [16-25] 3.5 [2.5-5.5] 0.9 [0.72-1.19] 1.1 [1-1.3] 25 [22-27] 19 [14-24] 18 [15-23] 3 [2-5] 0.8 [0.6-1.0] 1.2 [1.1-1.3] 32 [28-41] 37 [28-54] 21 [17-32] 4 [3-6.5] 1.1 [0.9-1.2] 1.1 [0.9-1.2] Steatosis scores AAR (U/L) (median [IQR]) TyG (mg/l) (median [IQR]) HIS (median [IQR]) ATE index (median [IQR]) 1.1 [0.9-1.4] 5.8 [5.6-6.1] 45 [40-50] 31 [23.8-44.5] 1.3 [1.1-1.6] 5.7 [5.5-6.0] 43 [39-46] 24,8 [21.3-29] 0.9 [0.6-1.1] 6.1 [5.8-6.2] 48 [43.5.-53.1] 44.7 [35.2.-57.9] Imaging ATT SOS E MRE 0.6 [0.5-0.7] 1.3 [1.2-1.5] 5.4 [4.4-6.5] 6.3 [6.0-7.3] 0.6 [0.5-0.7] 1.3 [1.2-1.5] 5.0 [4.3-6.2] 6.3 [5.9-7.3] 0.6 [0.5-0.7] 1.3 [1.2-1.5] 5.7 [4.7-7.1] 6.4 [6.0-7.3] Imaging definition using PDFF: * <5%; ** >5%.