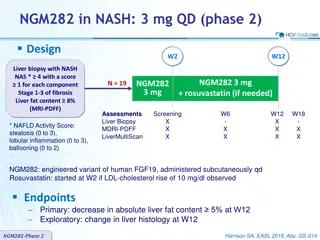
Liver Transplantation Report 2021/22 Statistics & Research Findings
The Annual Report on Liver Transplantation 2021/22 presents detailed statistics and clinical research findings from the NHS Blood and Transplant BLTG Transplant Meeting in September 2022. The report covers an overview, transplant list, donor and organ supply, transplant activity, and outcomes. It highlights transplant rates, deceased donor liver transplant program data, and the total number of liver transplants by donor type from April 2012 to March 2022. The report indicates a significant increase in liver transplants and active patients on the transplant list.

Download Presentation

Please find below an Image/Link to download the presentation.
The content on the website is provided AS IS for your information and personal use only. It may not be sold, licensed, or shared on other websites without obtaining consent from the author. Download presentation by click this link. If you encounter any issues during the download, it is possible that the publisher has removed the file from their server.
E N D
Presentation Transcript
Annual Report on Liver Transplantation 2021/22 Statistics and Clinical Research NHS Blood and Transplant BLTG Transplant Meeting, September 2022
Outline 1. Overview 2. Transplant list 3. Donor and organ supply 4. Transplant activity 5. Transplant outcomes
Transplant rates from 2020 Liver Transplant Rates 35.0 Transplants pmp 30.0 26.9 25.0 23.2 22.1 22.0 18.9 20.0 17.3 17.0 16.3 15.5 13.6 15.0 12.1 11.4 10.9 10.9 9.9 10.0 7.7 5.2 3.5 5.0 3.1 0.0 Country Source: Council of Europe Transplant Newsletter
Transplant rates from 2020 Liver transplant rates Deceased Donor: All Organ Transplant Rates 35.0 110.0 96.2 100.0 Transplants pmp Transplants pmp 86.4 30.0 90.0 26.9 80.0 63.759.8 59.458.4 58.055.551.8 51.750.3 49.745.842.8 25.0 70.0 23.2 22.1 22.0 60.0 18.9 50.0 20.0 17.3 17.0 34.431.129.3 28.9 40.0 16.3 30.0 15.5 22.1 13.6 15.0 12.1 20.0 12.5 11.4 10.9 10.9 9.9 10.0 10.0 7.7 0.0 5.2 3.5 5.0 3.1 Country 0.0 Country Source: Council of Europe Transplant Newsletter
Number of deceased donors, transplants and patients on the active transplant list - livers Figure 8.1 Deceased donor liver programme in the UK, 1 April 2012 - 31 March 2022, Number of donors, transplants and patients on the active transplant list at 31 March 1200 1148 Donors 1126 1113 Transplants 23% increase in deceased liver donors since 2012/2013 1041 Transplant list 1017 1013 1011 981 1000 946 932 924 923 879 879 870 842 825 823 784 800 749 Number 644 611 584 31% increase in deceased liver transplants since 2012/2013 600 549 530 492 450 432 400 359 200 123 0 2012-2013 2013-2014 2014-2015 2015-2016 2016-2017 2017-2018 2018-2019 2019-2020 2020-2021 2021-2022 Year Source: Organ and Tissue Donation and Transplantation Activity Report 2021/22
Deceased Donor Liver Transplant Programme 10% 17% 11% 10% 43% 524% Transplant list continues to increase: 677 patients active as at 18 August 2022 (additional 119 currently suspended)
Total number of liver transplants by donor type, 1 April 2012 31 March 2022 Figure 2.5 Total number of liver transplants by donor type, 1 April 2012 - 31 March 2022 1100 817 912 882 918 980 1043 1003 942 771 848 N = 1 29 1 1000 3 21 31 1 3% decrease in DBD liver transplants since 2012/2013 3 18 4 900 2 28 36 200 0 188 38 2 25 170 209 800 31 0 153 22 206 177 No. of transplants 700 136 194 121 600 43% increase in DCD liver transplants since 2012/13 500 400 300 813 793 753 737 727 673 665 648 628 629 200 100 0 2012-2013 2013-2014 2014-2015 2015-2016 2016-2017 2017-2018 2018-2019 2019-2020 2020-2021 2021-2022 Financial Year Source Liver transplantation annual report DBD DCD Living Domino
Deceased Donor Liver Transplants by donor type 16% DBD 0.2% DCD 14% 60 %
Deceased Donor Liver Transplants by age group 12% Adult 11% Paediatri c
Deceased Donor Liver Transplants by urgency status 12% Elective 7% Super- urgent 1% 32 %
Total number of liver transplants by donor and transplant type, 1 April 2009 31 March 2019 Figure 2.8 Total number of liver transplants by donor and transplant type, 1 April 2012 - 31 March 2022 1100 817 912 882 918 980 1043 1003 942 771 848 N = For DBD liver transplants in 2021/2022 91% were first grafts 8% were retransplants 2% were multi-organ 30 4 1000 22 5 34 3 19 7 900 32 39 2 3 196 40 183 25 2 6 800 33 163 24 206 12 3 151 22 16 8 87 14 203 10 91 No. of transplants 175 700 133 86 188 92 113 15 98 25 11 10 10 600 81 68 83 48 73 For DCD liver transplants 97% were first grafts 3% retransplants or multi-organ 500 400 300 702 690 651 631 619 200 569 569 571 565 545 100 0 2012-2013 2013-2014 2014-2015 2015-2016 2016-2017 2017-2018 2018-2019 2019-2020 2020-2021 2021-2022 Financial Year First DBD liver only Re-transplant DBD liver only Multi-organ DBD Source Liver transplantation annual report First DCD liver only Re-transplant/Multi-organ DCD Living/Domino
Liver transplants in the UK, 1 April 2012 31 March 2022
Are more liver transplant patients waiting in the UK than in other countries? Source: Council of Europe Transplant Newsletter * Patients on waiting list at 31 December 2020
Year-end transplant list (elective, first, liver-only registrations) Adult Paediatric
Year-end transplant list cont. (elective, first, liver-only registrations) Adult
Year-end transplant list cont. (elective, first, liver-only registrations) Paediatric 20 13 8 6 4 2
Post-registration outcome for new elective liver only registrations in 2019/2020 Adult Paediatric Figure 3.9 Post-registration outcome for 960 new elective adult liver only registrations made in the UK, 1 April 2019 - 31 March 2020 Figure 4.9 Post-registration outcome for 86 new elective paediatric liver only registrations made in the UK, 1 April 2019 - 31 March 2020 100 100 5 7 8 9 9 9 2 1 3 2 90 90 3 6 3 10 8 23 19 80 80 32 70 70 60 60 Percentage Percentage 50 50 84 40 40 78 77 70 69 61 30 30 20 20 10 10 0 0 6 months 1 year 2 years 6 months 1 year 2 years Time since listing Time since listing Transplanted Still waiting Removed Died/Removed* Transplanted Still waiting Removed Died/Removed* *Removals due to condition deteriorating *Removals due to condition deteriorating * Removals due to condition deteriorating
Five-year survival from listing from listing Risk-adjusted patient survival rate from time of listing for adult* elective first liver registrations, 1 January 2010 31 December 2021 adult* elective Figure 3.18 Risk-adjusted 5 year patient survival rate from time of listing for adult* elective first liver registrations, 1 January 2010 - 31 December 2021 85 Edinburgh % 5 year patient survival from listing King's College Cambridge 75 Royal Free Newcastle Leeds Birmingham 65 55 99.8% Upper CL 95% Lower CL 95% Upper CL 99.8% Lower CL National rate Risk-adjusted centre rate 45 0 500 1000 1500 2000 2500 Number of patients * In this analysis, adult patients are defined as 18 years old and older.
Demographics of deceased donors, 2012 - 2022 Donor age Donor BMI Age 70+ BMI 30+ Figure 3.1 Age of deceased donors in the UK, 1 April 2012 - 31 March 2022 Figure 3.2 BMI of deceased donors in the UK, 1 April 2012 - 31 March 2022 N= 1212 1320 1282 1364 1413 1574 1600 1580 1180 1397 N= 1211 1319 1282 1363 1413 1574 1600 1580 1180 1397 100 100 8 11 12 12 13 14 14 15 15 15 90 90 22 23 24 24 25 25 25 25 27 29 18 80 80 22 22 23 25 22 22 21 22 23 70 70 Percentage Percentage 60 60 29 25 26 22 24 25 24 26 25 24 50 50 71 69 69 67 67 70 68 67 40 40 67 65 30 30 41 39 37 36 36 37 36 35 34 35 20 20 10 10 8 8 8 7 7 7 7 7 7 6 4 4 4 4 4 4 4 3 3 3 0 0 2012-2013 2013-2014 2014-2015 2015-2016 2016-2017 2017-2018 2018-2019 2019-2020 2020-2021 2021-2022 2012-2013 2013-2014 2014-2015 2015-2016 2016-2017 2017-2018 2018-2019 2019-2020 2020-2021 2021-2022 Year Year 0-17 18-49 50-59 60-69 70+ 0-19 20-29 30+ Source: Organ Donation and Transplantation Activity Report 2021/22
Percentage of livers retrieved that were not transplanted from deceased organ donors in the UK, 1 April 2012 31 March 2022 Figure 4.4 Percentage of livers retrieved that were not transplanted from deceased organ donors in the UK, 1 April 2012 - 31 March 2022 Total retrieved: 825 932 924 1011 1041 1148 1113 1126 870 1017 25 21 21 20 18 % not transplanted 17 15 15 15 15 13 12 11 10 5 0 2012-2013 2013-2014 2014-2015 2015-2016 2016-2017 2017-2018 2018-2019 2019-2020 2020-2021 2021-2022 Year
Percentage of livers retrieved that were not transplanted from deceased organ donors in the UK, by donor type, 1 April 2012 31 March 2022 Total retrieved 640 185 712 220 684 240 715 296 746 295 850 298 855 258 845 278 688 182 702 308 40 38.8 37.3 34.6 32.6 30.5 30.4 30 29.2 27.5 26.5 26.3 % not transplanted 20 14.9 14.2 13.8 11 10.9 9.8 10 9.1 8.9 7.2 4.9 0 2012/2013 2013/2014 2014/2015 2015/2016 2016/2017 2017/2018 2018/2019 2019/2020 2020/2021 2021/2022 DBD DCD
Adult elective liver offer decline rates that resulted in whole liver transplants, 2019 - 2022 DBD named patients transplant from DBD donors, 1 April 2019 and 31 March 2022 DCD centre Figure 3.11 Named adult elective liver offer decline rates that resulted in a liver only first Figure 3.12 Adult elective liver offer decline rates that resulted in a liver only first transplant from DCD donors, 1 April 2019 and 31 March 2022 100 100 80 80 Newcastle Cambridge Offer decline rate (%) Offer decline rate (%) Newcastle Edinburgh Edinburgh Royal FreeLeeds 60 60 King's College Leeds Birmingham Birmingham Cambridge 40 40 Royal Free King's College 20 20 99.8% Upper CL 95% Lower CL 99.8% Upper CL 95% Lower CL 95% Upper CL 99.8% Lower CL 95% Upper CL 99.8% Lower CL National rate Centre rate National rate Centre rate 0 0 0 50 100 150 200 250 300 350 400 450 500 550 0 10 20 30 40 50 60 70 80 90 100 110 120 130 140 150 160 170 180 Centre specific offers Centre specific offers
Adult liver only transplants, 2012 2022 Figure 3.14 Adult elective liver only transplants by donor type and centre, 1 April 2012 - 31 March 2022 Birmingham Cambridge Edinburgh King's College 200 180 170170166171163 Elective Super-urgent 128 151160168 150152156 156 160 151 141145137 Figure 3.14 Adult elective liver only transplants by donor type and centre, 1 April 2012 - 31 March 2022 140 Figure 3.20 Adult super-urgent* liver only transplants by centre, 1 April 2012 - 31 March 2022 138 137 Birmingham Cambridge 120 Edinburgh King's College Birmingham Cambridge Edinburgh King's College 107 200 30 879498 100 687684 82858893 88 180 170170166171163 151160168 80 77 80 150152156 156 160 151 66 6568 141145137 21 61 6056 138 137 20 140 No. of transplants 1918 60 20 128 50 1817 17 120 16 107 15 15 40 879498 20 100 687684 82858893 1213 88 12 12 1110 11 11 80 77 10 10 80 66 6568 9 9 10 No. of transplants 8 8 8 61 6056 No. of transplants 60 50 0 6 6 6 6 5 5 4 4 4 4 40 3 3 3 2 2 Leeds Newcastle Royal Free 20 0 0 200 Leeds Newcastle Royal Free Leeds Newcastle 180 Royal Free 30 200 160 180 160 140 20 124 120 140 120 124 120 107 105 120 14 101 107 111213 7885 111213 105 97 97 97 101 1112 100 97 11 100 85 87 86 85 85 87 86 7885 77 85 8278 8278 9 9 10 79 79 77 8 8 80 80 69 7 7 7 69 63 6 6 6 61 63 61 5 5 5 60 4 4 60 3 3 3 3 3 36 33 322632 34312428 26 40 36 33 322632 34312428 26 40 0 20 2012-2013 2013-2014 2014-2015 2015-2016 2016-2017 2017-2018 2018-2019 2019-2020 2020-2021 2021-2022 2012-2013 2013-2014 2014-2015 2015-2016 2016-2017 2017-2018 2018-2019 2019-2020 2020-2021 2021-2022 2012-2013 2013-2014 2014-2015 2015-2016 2016-2017 2017-2018 2018-2019 2019-2020 2020-2021 2021-2022 2012-2013 2013-2014 2014-2015 2015-2016 2016-2017 2017-2018 2018-2019 2019-2020 2020-2021 2021-2022 0 20 2012-2013 2013-2014 2014-2015 2015-2016 2016-2017 2017-2018 2018-2019 2019-2020 2020-2021 2021-2022 2012-2013 2013-2014 2014-2015 2015-2016 2016-2017 2017-2018 2018-2019 2019-2020 2012-2013 2020-2021 2013-2014 2021-2022 2014-2015 2012-2013 2015-2016 2013-2014 2016-2017 2014-2015 2017-2018 2015-2016 2018-2019 2016-2017 2019-2020 2017-2018 2018-2019 2020-2021 2019-2020 2021-2022 2020-2021 2021-2022 2012-2013 2012-2013 2013-2014 2013-2014 2014-2015 2014-2015 2015-2016 2015-2016 2016-2017 2016-2017 2017-2018 2018-2019 2017-2018 2019-2020 2018-2019 2020-2021 2019-2020 2021-2022 0 Financial Year 2015-2016 2020-2021 2021-2022 2012-2013 2013-2014 2014-2015 2015-2016 2016-2017 2017-2018 2018-2019 2019-2020 2020-2021 2021-2022 2012-2013 2013-2014 2014-2015 2016-2017 2017-2018 2018-2019 2019-2020 2020-2021 2021-2022 Financial Year DBD DCD DBD DCD Living (including domino) *Super-urgent registration categories were changed on 17 June 2015 to account for developments in treatment of patients with acute liver failure Financial Year *Excludes 23 and 7 living liver transplants at London Bridge Hospital and Cromwell Hospital, respectively DBD DCD Living (including domino) *Excludes 23 and 7 living liver transplants at London Bridge Hospital and Cromwell Hospital, respectively
Paediatric liver only transplants, 2012 2022 Figure 4.12 Paediatric elective liver only transplants by centre, 1 April 2012 - 31 March 2022 Birmingham King's College Leeds 50 46 42 41 41 No. of transplants 40 40 Elective 31 30 28 28 27 25 23 23 22 22 21 20 20 20 20 19 19 19 20 16 16 15 15 15 15 13 13 10 0 2012-2013 2013-2014 2014-2015 2015-2016 2016-2017 2017-2018 2018-2019 2019-2020 2020-2021 2021-2022 2012-2013 2013-2014 2014-2015 2015-2016 2016-2017 2017-2018 2018-2019 2019-2020 2020-2021 2021-2022 2012-2013 2013-2014 2014-2015 2015-2016 2016-2017 2017-2018 2018-2019 2019-2020 2020-2021 2021-2022 Financial Year Figure 4.14 Paediatric super-urgent* liver only transplants by centre, 1 April 2012 - 31 March 2022 DBD Living King's College DCD Birmingham Leeds 15 13 No. of transplants 12 12 Super-urgent 10 9 7 6 6 6 6 6 5 5 5 5 3 3 3 3 3 3 2 2 2 1 1 1 1 1 1 0 2012-2013 2013-2014 2014-2015 2015-2016 2016-2017 2017-2018 2018-2019 2019-2020 2020-2021 2021-2022 2012-2013 2013-2014 2014-2015 2015-2016 2016-2017 2017-2018 2018-2019 2019-2020 2020-2021 2021-2022 2012-2013 2013-2014 2014-2015 2015-2016 2016-2017 2017-2018 2018-2019 2019-2020 2020-2021 2021-2022 Financial Year DBD Living (including domino) DCD *Super-urgent registration categories were changed on 17 June 2015 to account for developments in treatment of patients with acute liver failure
Cold ischaemia time for adult first deceased donor liver only transplants, 2012-2022 Figure 3.3 Boxplot of cold ischaemia time in all adult first deceased donor liver transplants, by donor type and financial year 1 April 2012 - 31 March 2022 DBD DCD 25 20 Cold ischaemia time (hours) 15 10 5 0 2012/2013 2013/2014 2014/2015 2015/2016 2016/2017 2017/2018 2018/2019 2019/2020 2020/2021 2021/2022 2012/2013 2013/2014 2014/2015 2015/2016 2016/2017 2017/2018 2018/2019 2019/2020 2020/2021 2021/2022 Year
Cold ischaemia time for adult first deceased donor liver only transplants, 2021/ 2022 Figure 3.4 Boxplot of cold ischaemia time in all adult first deceased donor liver transplants, by donor type and transplant centre 1 April 2021 - 31 March 2022 DBD DCD 25 20 Cold ischaemia time (hours) 15 10 5 0 Birmingham Cambridge Edinburgh King's Leeds Newcastle Royal Free Birmingham Cambridge Edinburgh King's Leeds Newcastle Royal Free College College Transplant centre
Survival after first elective adult whole liver only transplant from DBD donors Year of transplant No. at risk on day 0 % Patient survival (95% confidence interval) One year Two year Five year Ten year 2008-2010 2011-2013 2014-2016 2017-2020 1144 1281 1394 2078 93 93 93 95 (91-94) (92-95) (92-95) (94-96) 91 91 91 (89-92) (89-92) (90-93) 82 84 84 (79-84) (82-86) (82-86) 71 (68-73)
Long-term survival after first elective adult whole liver only transplant from DBD donors Year of transplant No. at risk on day 0 % Patient survival (95% confidence interval) 15 year 20 year 25 year 30 year 1970-1987 1988-1992 1993-1997 1998-2002 2003-2007 386 1052 1829 2043 1508 23 43 46 48 49 (18-27) (40-46) (44-49) (46-50) (46-51) 19 34 34 34 (15-23) (31-37) (31-36) (32-37) 15 25 23 (12-20) (22-28) (21-25) 11 16 (7-15) (14-19)
Survival after first elective adult whole liver only transplant from DCD donors Year of transplant No. at risk on day 0 % Patient survival (95% confidence interval) One year Two year Five year Ten year 2008-2010 2011-2013 2014-2016 2017-2020 247 397 559 648 86 92 94 94 (81-90) (89-95) (92-96) (92-96) 80 89 92 (74-84) (86-92) (89-94) 73 79 82 (67-79) (75-83) (78-85) 63 (57-69)
Survival after first elective paediatric whole liver only transplant from DBD donors Year of transplant No. at risk on day 0 % Patient survival (95% confidence interval) One year Two year Five year Ten year 2008-2010 2011-2013 2014-2016 2017-2020 146 161 149 211 96 94 99 94 (91-98) (90-97) (95-100) (89-96) 93 93 98 (88-96) (88-96) (94-99) 92 90 97 (87-96) (85-94) (93-99) 89 (82-93)
Long-term survival after first elective paediatric whole liver only transplant from DBD donors Year of transplant No. at risk on day 0 % Patient survival (95% confidence interval) 15 year 20 year 25 year 30 year 1970-1987 1988-1992 1993-1997 1998-2002 2003-2007 82 234 267 271 196 37 65 75 84 81 (27-48) (59-71) (69-80) (79-88) (75-86) 37 62 70 82 (27-48) (56-68) (64-75) (76-86) 37 57 66 (27-48) (50-64) (59-72) 35 52 (25-46) (44-59)
Summary Activity Liver waiting list has risen since last year to 682 patients Significant centre variation in offer decline rates Approx 800 adult and 90 paediatric patients transplanted each year Patient outcomes Long-term patient survival has improved - adults: 20% in 1970/80s vs 50% in 2000s; paediatrics: 40% in 1970/80s vs 80% in 2000s By centre survival from listing and survival post-transplantation at five years generally statistically consistent with the national survival rate National Liver Offering Scheme Implemented 20th March 2018 Designed to improve matching of organs at a patient level rather than by hospital. Will be updated in Autumn 2022
Liver Transplantation Annual Report: https://www.odt.nhs.uk/statistics-and-reports/organ-specific-reports/ This presentation: https://www.odt.nhs.uk/statistics-and-reports/slides-and-presentations/
Figure 3.15 Risk-adjusted 1 year patient survival rates for adult elective deceased donor first liver transplants, 1 April 2017 - 31 March 2021 100 King's College Cambridge Birmingham Edinburgh Leeds Newcastle Royal Free 90 % 1 year patient survival 80 70 60 99.8% Upper CL Risk-adjusted centre rate 95% Upper CL 95% Lower CL National rate 99.8% Lower CL 50 0 100 200 300 400 500 600 700 Number of transplants Source: Annual Report for Liver Transplantation 2014/15, NHS Blood and Transplant Source: Annual Report on Liver Transplantation 2021/22, NHS Blood and Transplant
Figure 3.16 Risk-adjusted 5 year patient survival rates for adult elective deceased donor first liver transplants, 1 April 2013 - 31 March 2017 100 90 Royal Free Edinburgh King's College Cambridge % 5 year patient survival Birmingham Leeds 80 Newcastle 70 60 99.8% Upper CL Risk-adjusted centre rate 95% Upper CL 95% Lower CL National rate 99.8% Lower CL 50 0 100 200 300 400 500 600 Number of transplants Source: Annual Report for Liver Transplantation 2014/15, NHS Blood and Transplant Source: Annual Report on Liver Transplantation 2021/22, NHS Blood and Transplant
Figure 3.21 Risk-adjusted 1 year patient survival rates for adult super-urgent deceased donor first liver transplants, 1 April 2017 - 31 March 2021 100 Edinburgh Cambridge Royal Free 90 Leeds King's College Birmingham % 1 year patient survival 80 Newcastle 70 60 50 99.8% Upper CL Risk-adjusted centre rate 95% Upper CL 95% Lower CL National rate 99.8% Lower CL 40 0 25 50 75 Number of transplants Source: Annual Report for Liver Transplantation 2014/15, NHS Blood and Transplant Source: Annual Report on Liver Transplantation 2021/22, NHS Blood and Transplant
Figure 3.22 Risk-adjusted 5 year patient survival rates for adult super-urgent deceased donor first liver transplants, 1 April 2013 - 31 March 2017 100 90 Birmingham Royal Free Newcastle Cambridge % 5 year patient survival Leeds Edinburgh 80 King's College 70 60 50 99.8% Upper CL Risk-adjusted centre rate 95% Upper CL 95% Lower CL National rate 99.8% Lower CL 40 0 25 50 75 Number of transplants Source: Annual Report for Liver Transplantation 2014/15, NHS Blood and Transplant Source: Annual Report on Liver Transplantation 2021/22, NHS Blood and Transplant