Understanding Time Modeling in Event Simulation

Explore the modeling of event arrival time in simulations using random numbers and a specific formula. Understand the concepts involved and convince yourself of its accuracy through various hints and considerations. Dive deep into probability distributions, integration, and solving for time.

Download Presentation

Please find below an Image/Link to download the presentation.
The content on the website is provided AS IS for your information and personal use only. It may not be sold, licensed, or shared on other websites without obtaining consent from the author. Download presentation by click this link. If you encounter any issues during the download, it is possible that the publisher has removed the file from their server.
E N D
Presentation Transcript
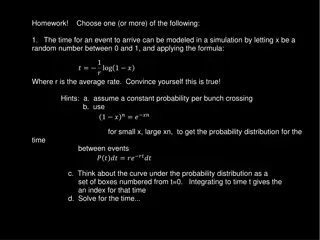
Homework! Choose one (or more) of the following: 1. The time for an event to arrive can be modeled in a simulation by letting x be a random number between 0 and 1, and applying the formula: ? = 1 ?log 1 ? Where r is the average rate. Convince yourself this is true! Hints: a. assume a constant probability per bunch crossing b. use 1 ??= ? ?? time between events for small x, large xn, to get the probability distribution for the ? ? ?? = ?? ???? c. Think about the curve under the probability distribution as a set of boxes numbered from t=0. Integrating to time t gives the an index for that time d. Solve for the time...
Small Event Simulation of STAR DAQ TPC DAQ 2. Using the small event simulation: a.What is the source of the linear deadtime below 1500hz? b.What is the source of the curved deadtime above 1500hz? c.Why are the curves for ps=10 sharper? d.What would the happen if the number of TPC buffers were increased or decreased?
3. Data transfers typically are modeled as taking time: TransferTime = Latency + ThroughputRate * sz Choose a parameter: a. Disk write speed b. Disk read speed c. Ethernet transfer speed d. Memcpy() speed Write a program to measure the speed of any of these and plot transfer time vs transfer size! Do the results fit this model, if not can you figure out why?
4. Choose a STAR run and describe what is being done Ask me for a good run! Study and understand the web pages Ask me! https://online.star.bnl.gov -> Trigger Versioning -> DAQ Monitoring -> Online QA Histograms
 of the following:")